
 Yahoo Finance
 Investors Who Bought Great Elm Capital Group (NASDAQ:GEC) Shares Three Years Ago Are Now Down 17%

In order to justify the effort of selecting individual stocks, it's worth striving to beat the returns from a market index fund. But the risk of stock picking is that you will likely buy under-performing companies. Unfortunately, that's been the case for longer term Great Elm Capital Group, Inc. (NASDAQ:GEC) shareholders, since the share price is down 17% in the last three years, falling well short of the market return of around 52%. Furthermore, it's down 15% in about a quarter. That's not much fun for holders.
View our latest analysis for Great Elm Capital Group
Because Great Elm Capital Group made a loss in the last twelve months, we think the market is probably more focussed on revenue and revenue growth, at least for now. Shareholders of unprofitable companies usually expect strong revenue growth. Some companies are willing to postpone profitability to grow revenue faster, but in that case one does expect good top-line growth.
Over three years, Great Elm Capital Group grew revenue at 108% per year. That's well above most other pre-profit companies. The share price drop of 6.1% per year over three years would be considered disappointing by many, so you might argue the company is getting little credit for its impressive revenue growth. It's possible that the prior share price assumed unrealistically high future growth. Before considering a purchase, investors should consider how quickly expenses are growing, relative to revenue.
The graphic below depicts how earnings and revenue have changed over time (unveil the exact values by clicking on the image).
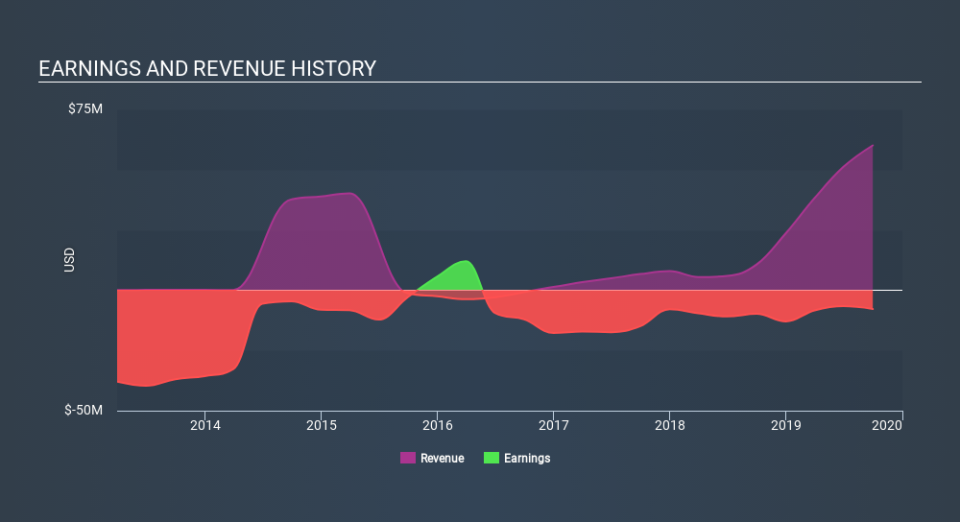
You can see how its balance sheet has strengthened (or weakened) over time in this free interactive graphic.
A Different Perspective
Over the last year, Great Elm Capital Group shareholders took a loss of 9.0%. In contrast the market gained about 27%. However, keep in mind that even the best stocks will sometimes underperform the market over a twelve month period. The three-year loss of 6.1% per year isn't as bad as the last twelve months, suggesting that the company has not been able to convince the market it has solved its problems. We would be wary of buying into a company with unsolved problems, although some investors will buy into struggling stocks if they believe the price is sufficiently attractive. I find it very interesting to look at share price over the long term as a proxy for business performance. But to truly gain insight, we need to consider other information, too. Take risks, for example - Great Elm Capital Group has 4 warning signs (and 1 which is concerning) we think you should know about.
If you like to buy stocks alongside management, then you might just love this free list of companies. (Hint: insiders have been buying them).
Please note, the market returns quoted in this article reflect the market weighted average returns of stocks that currently trade on US exchanges.
If you spot an error that warrants correction, please contact the editor at editorial-team@simplywallst.com. This article by Simply Wall St is general in nature. It does not constitute a recommendation to buy or sell any stock, and does not take account of your objectives, or your financial situation. Simply Wall St has no position in the stocks mentioned.
We aim to bring you long-term focused research analysis driven by fundamental data. Note that our analysis may not factor in the latest price-sensitive company announcements or qualitative material. Thank you for reading.
