
 Yahoo Finance
 Investors Who Bought Just Group (LON:JUST) Shares A Year Ago Are Now Up 115%
The most you can lose on any stock (assuming you don't use leverage) is 100% of your money. But when you pick a company that is really flourishing, you can make more than 100%. Take, for example Just Group plc (LON:JUST). Its share price is already up an impressive 115% in the last twelve months. Also pleasing for shareholders was the 27% gain in the last three months. Zooming out, the stock is actually down 29% in the last three years.
See our latest analysis for Just Group
To quote Buffett, 'Ships will sail around the world but the Flat Earth Society will flourish. There will continue to be wide discrepancies between price and value in the marketplace...' One flawed but reasonable way to assess how sentiment around a company has changed is to compare the earnings per share (EPS) with the share price.
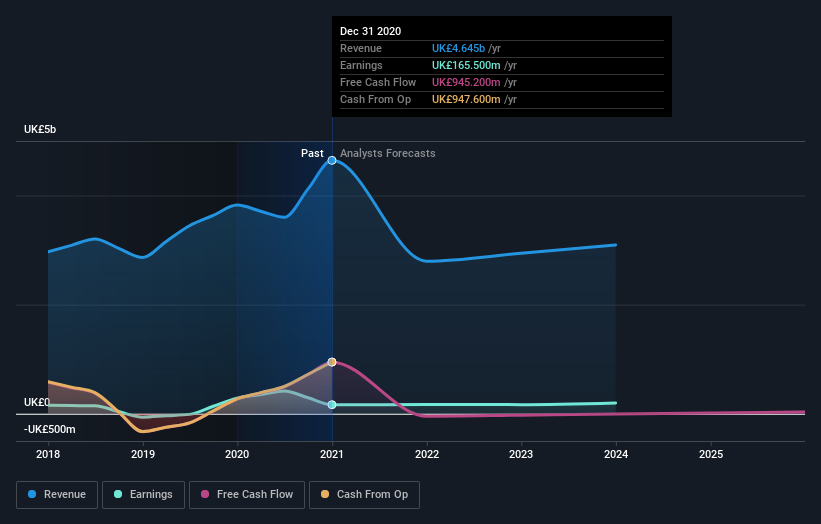
During the last year, Just Group actually saw its earnings per share drop 44%.
This means it's unlikely the market is judging the company based on earnings growth. Since the change in EPS doesn't seem to correlate with the change in share price, it's worth taking a look at other metrics.
However the year on year revenue growth of 21% would help. We do see some companies suppress earnings in order to accelerate revenue growth.
The image below shows how earnings and revenue have tracked over time (if you click on the image you can see greater detail).
If you are thinking of buying or selling Just Group stock, you should check out this FREE detailed report on its balance sheet.
A Different Perspective
It's nice to see that Just Group shareholders have received a total shareholder return of 115% over the last year. That certainly beats the loss of about 4% per year over the last half decade. This makes us a little wary, but the business might have turned around its fortunes. It's always interesting to track share price performance over the longer term. But to understand Just Group better, we need to consider many other factors. Take risks, for example - Just Group has 1 warning sign we think you should be aware of.
We will like Just Group better if we see some big insider buys. While we wait, check out this free list of growing companies with considerable, recent, insider buying.
Please note, the market returns quoted in this article reflect the market weighted average returns of stocks that currently trade on GB exchanges.
This article by Simply Wall St is general in nature. It does not constitute a recommendation to buy or sell any stock, and does not take account of your objectives, or your financial situation. We aim to bring you long-term focused analysis driven by fundamental data. Note that our analysis may not factor in the latest price-sensitive company announcements or qualitative material. Simply Wall St has no position in any stocks mentioned.
Have feedback on this article? Concerned about the content? Get in touch with us directly. Alternatively, email editorial-team (at) simplywallst.com.
