
 Yahoo Finance
 Investors Who Bought Renishaw (LON:RSW) Shares Five Years Ago Are Now Up 203%

When you buy a stock there is always a possibility that it could drop 100%. But on the bright side, you can make far more than 100% on a really good stock. One great example is Renishaw plc (LON:RSW) which saw its share price drive 203% higher over five years. It's also good to see the share price up 19% over the last quarter.
See our latest analysis for Renishaw
To paraphrase Benjamin Graham: Over the short term the market is a voting machine, but over the long term it's a weighing machine. One imperfect but simple way to consider how the market perception of a company has shifted is to compare the change in the earnings per share (EPS) with the share price movement.
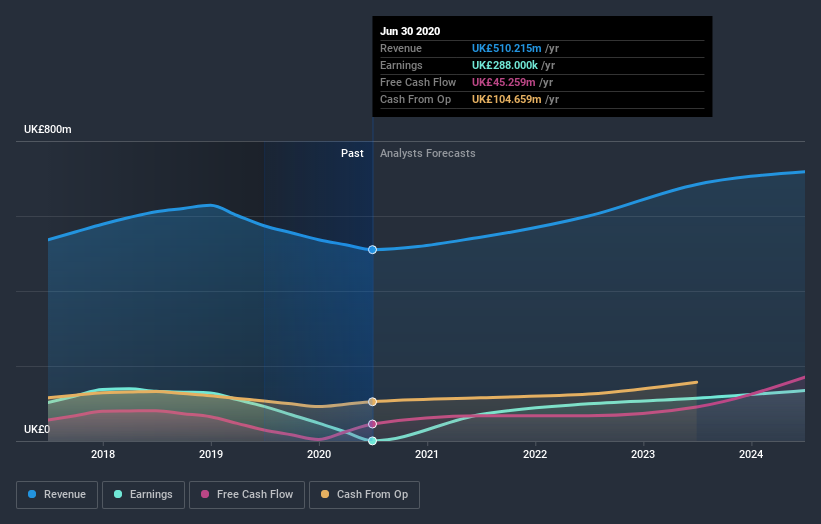
Renishaw's earnings per share are down 70% per year, despite strong share price performance over five years. The impact of extraordinary items on earnings, in the last year, partially explain the diversion.
This means it's unlikely the market is judging the company based on earnings growth. Because earnings per share don't seem to match up with the share price, we'll take a look at other metrics instead.
On the other hand, Renishaw's revenue is growing nicely, at a compound rate of 4.5% over the last five years. In that case, the company may be sacrificing current earnings per share to drive growth.
The image below shows how earnings and revenue have tracked over time (if you click on the image you can see greater detail).
We're pleased to report that the CEO is remunerated more modestly than most CEOs at similarly capitalized companies. It's always worth keeping an eye on CEO pay, but a more important question is whether the company will grow earnings throughout the years. So it makes a lot of sense to check out what analysts think Renishaw will earn in the future (free profit forecasts).
What about the Total Shareholder Return (TSR)?
Investors should note that there's a difference between Renishaw's total shareholder return (TSR) and its share price change, which we've covered above. Arguably the TSR is a more complete return calculation because it accounts for the value of dividends (as if they were reinvested), along with the hypothetical value of any discounted capital that have been offered to shareholders. Renishaw's TSR of 222% for the 5 years exceeded its share price return, because it has paid dividends.
A Different Perspective
We're pleased to report that Renishaw shareholders have received a total shareholder return of 80% over one year. That's better than the annualised return of 26% over half a decade, implying that the company is doing better recently. Given the share price momentum remains strong, it might be worth taking a closer look at the stock, lest you miss an opportunity. I find it very interesting to look at share price over the long term as a proxy for business performance. But to truly gain insight, we need to consider other information, too. Take risks, for example - Renishaw has 4 warning signs we think you should be aware of.
If you like to buy stocks alongside management, then you might just love this free list of companies. (Hint: insiders have been buying them).
Please note, the market returns quoted in this article reflect the market weighted average returns of stocks that currently trade on GB exchanges.
This article by Simply Wall St is general in nature. It does not constitute a recommendation to buy or sell any stock, and does not take account of your objectives, or your financial situation. We aim to bring you long-term focused analysis driven by fundamental data. Note that our analysis may not factor in the latest price-sensitive company announcements or qualitative material. Simply Wall St has no position in any stocks mentioned.
Have feedback on this article? Concerned about the content? Get in touch with us directly. Alternatively, email editorial-team@simplywallst.com.
