
 Yahoo Finance
 Investors Who Bought Westpac Banking (ASX:WBC) Shares Three Years Ago Are Now Down 27%

For many investors, the main point of stock picking is to generate higher returns than the overall market. But if you try your hand at stock picking, your risk returning less than the market. We regret to report that long term Westpac Banking Corporation (ASX:WBC) shareholders have had that experience, with the share price dropping 27% in three years, versus a market return of about 30%. The falls have accelerated recently, with the share price down 13% in the last three months.
See our latest analysis for Westpac Banking
While the efficient markets hypothesis continues to be taught by some, it has been proven that markets are over-reactive dynamic systems, and investors are not always rational. One imperfect but simple way to consider how the market perception of a company has shifted is to compare the change in the earnings per share (EPS) with the share price movement.
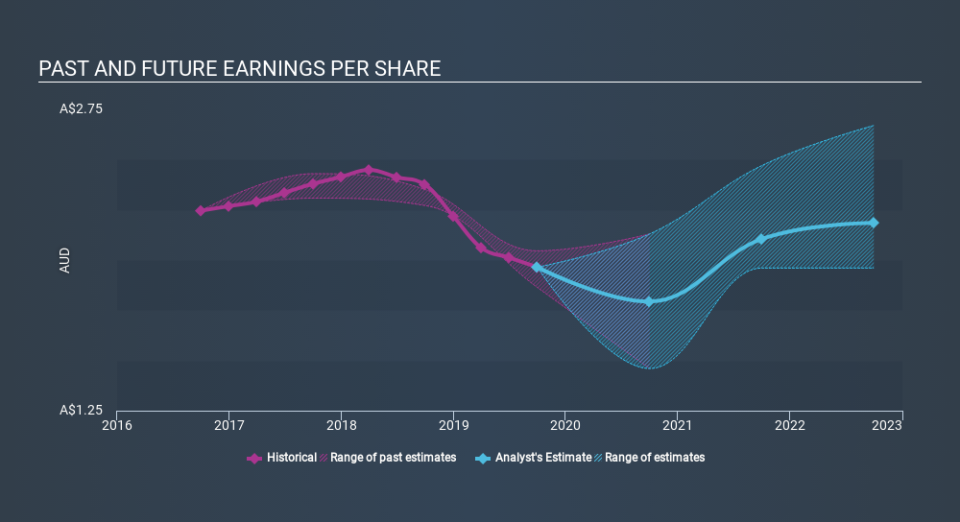
Westpac Banking saw its EPS decline at a compound rate of 4.4% per year, over the last three years. This reduction in EPS is slower than the 9.9% annual reduction in the share price. So it's likely that the EPS decline has disappointed the market, leaving investors hesitant to buy.
The graphic below depicts how EPS has changed over time (unveil the exact values by clicking on the image).
We like that insiders have been buying shares in the last twelve months. Having said that, most people consider earnings and revenue growth trends to be a more meaningful guide to the business. This free interactive report on Westpac Banking's earnings, revenue and cash flow is a great place to start, if you want to investigate the stock further.
What About Dividends?
When looking at investment returns, it is important to consider the difference between total shareholder return (TSR) and share price return. The TSR incorporates the value of any spin-offs or discounted capital raisings, along with any dividends, based on the assumption that the dividends are reinvested. Arguably, the TSR gives a more comprehensive picture of the return generated by a stock. In the case of Westpac Banking, it has a TSR of -12% for the last 3 years. That exceeds its share price return that we previously mentioned. This is largely a result of its dividend payments!
A Different Perspective
Westpac Banking shareholders gained a total return of 2.9% during the year. Unfortunately this falls short of the market return. The silver lining is that the gain was actually better than the average annual return of 0.2% per year over five year. This suggests the company might be improving over time. It is all well and good that insiders have been buying shares, but we suggest you check here to see what price insiders were buying at.
Westpac Banking is not the only stock that insiders are buying. For those who like to find winning investments this free list of growing companies with recent insider purchasing, could be just the ticket.
Please note, the market returns quoted in this article reflect the market weighted average returns of stocks that currently trade on AU exchanges.
If you spot an error that warrants correction, please contact the editor at editorial-team@simplywallst.com. This article by Simply Wall St is general in nature. It does not constitute a recommendation to buy or sell any stock, and does not take account of your objectives, or your financial situation. Simply Wall St has no position in the stocks mentioned.
We aim to bring you long-term focused research analysis driven by fundamental data. Note that our analysis may not factor in the latest price-sensitive company announcements or qualitative material. Thank you for reading.
