
 Yahoo Finance
 Are Investors Concerned With What's Going On At N Brown Group (LON:BWNG)?

Want to participate in a short research study? Help shape the future of investing tools and earn a $40 gift card!
What financial metrics can indicate to us that a company is maturing or even in decline? Typically, we'll see the trend of both return on capital employed (ROCE) declining and this usually coincides with a decreasing amount of capital employed. This reveals that the company isn't compounding shareholder wealth because returns are falling and its net asset base is shrinking. So after we looked into N Brown Group (LON:BWNG), the trends above didn't look too great.
What is Return On Capital Employed (ROCE)?
For those that aren't sure what ROCE is, it measures the amount of pre-tax profits a company can generate from the capital employed in its business. The formula for this calculation on N Brown Group is:
Return on Capital Employed = Earnings Before Interest and Tax (EBIT) ÷ (Total Assets - Current Liabilities)
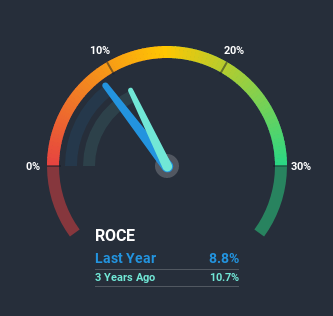
0.088 = UK£77m ÷ (UK£1.0b - UK£139m) (Based on the trailing twelve months to February 2020).
So, N Brown Group has an ROCE of 8.8%. On its own that's a low return on capital but it's in line with the industry's average returns of 8.8%.
View our latest analysis for N Brown Group
In the above chart we have a measured N Brown Group's prior ROCE against its prior performance, but the future is arguably more important. If you'd like, you can check out the forecasts from the analysts covering N Brown Group here for free.
The Trend Of ROCE
We are a bit worried about the trend of returns on capital at N Brown Group. Unfortunately the returns on capital have diminished from the 13% that they were earning five years ago. Meanwhile, capital employed in the business has stayed roughly the flat over the period. Since returns are falling and the business has the same amount of assets employed, this can suggest it's a mature business that hasn't had much growth in the last five years. If these trends continue, we wouldn't expect N Brown Group to turn into a multi-bagger.
What We Can Learn From N Brown Group's ROCE
In summary, it's unfortunate that N Brown Group is generating lower returns from the same amount of capital. This could explain why the stock has sunk a total of 86% in the last five years. Unless these trends revert to a more positive trajectory, we would look elsewhere.
One more thing: We've identified 4 warning signs with N Brown Group (at least 2 which make us uncomfortable) , and understanding these would certainly be useful.
For those who like to invest in solid companies, check out this free list of companies with solid balance sheets and high returns on equity.
This article by Simply Wall St is general in nature. It does not constitute a recommendation to buy or sell any stock, and does not take account of your objectives, or your financial situation. We aim to bring you long-term focused analysis driven by fundamental data. Note that our analysis may not factor in the latest price-sensitive company announcements or qualitative material. Simply Wall St has no position in any stocks mentioned.
Have feedback on this article? Concerned about the content? Get in touch with us directly. Alternatively, email editorial-team@simplywallst.com.
