
 Yahoo Finance
 Investors in ConnectOne Bancorp (NASDAQ:CNOB) have unfortunately lost 28% over the last three years
In order to justify the effort of selecting individual stocks, it's worth striving to beat the returns from a market index fund. But if you try your hand at stock picking, you risk returning less than the market. Unfortunately, that's been the case for longer term ConnectOne Bancorp, Inc. (NASDAQ:CNOB) shareholders, since the share price is down 34% in the last three years, falling well short of the market return of around 21%. Even worse, it's down 16% in about a month, which isn't fun at all.
Now let's have a look at the company's fundamentals, and see if the long term shareholder return has matched the performance of the underlying business.
See our latest analysis for ConnectOne Bancorp
To paraphrase Benjamin Graham: Over the short term the market is a voting machine, but over the long term it's a weighing machine. By comparing earnings per share (EPS) and share price changes over time, we can get a feel for how investor attitudes to a company have morphed over time.
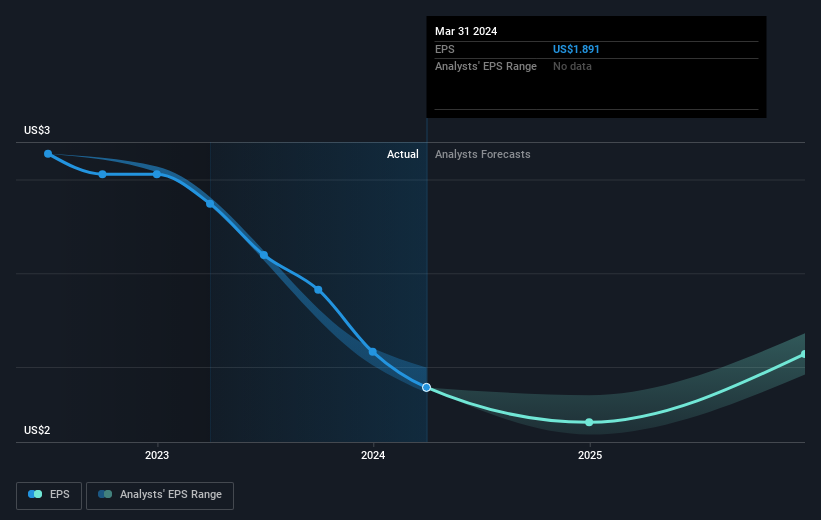
ConnectOne Bancorp saw its EPS decline at a compound rate of 8.2% per year, over the last three years. This reduction in EPS is slower than the 13% annual reduction in the share price. So it seems the market was too confident about the business, in the past. The less favorable sentiment is reflected in its current P/E ratio of 9.24.
The company's earnings per share (over time) is depicted in the image below (click to see the exact numbers).
We consider it positive that insiders have made significant purchases in the last year. Having said that, most people consider earnings and revenue growth trends to be a more meaningful guide to the business. This free interactive report on ConnectOne Bancorp's earnings, revenue and cash flow is a great place to start, if you want to investigate the stock further.
What About Dividends?
As well as measuring the share price return, investors should also consider the total shareholder return (TSR). The TSR is a return calculation that accounts for the value of cash dividends (assuming that any dividend received was reinvested) and the calculated value of any discounted capital raisings and spin-offs. Arguably, the TSR gives a more comprehensive picture of the return generated by a stock. As it happens, ConnectOne Bancorp's TSR for the last 3 years was -28%, which exceeds the share price return mentioned earlier. And there's no prize for guessing that the dividend payments largely explain the divergence!
A Different Perspective
ConnectOne Bancorp shareholders are up 8.3% for the year (even including dividends). But that return falls short of the market. On the bright side, that's still a gain, and it is certainly better than the yearly loss of about 1.7% endured over half a decade. So this might be a sign the business has turned its fortunes around. It is all well and good that insiders have been buying shares, but we suggest you check here to see what price insiders were buying at.
There are plenty of other companies that have insiders buying up shares. You probably do not want to miss this free list of undervalued small cap companies that insiders are buying.
Please note, the market returns quoted in this article reflect the market weighted average returns of stocks that currently trade on American exchanges.
Have feedback on this article? Concerned about the content? Get in touch with us directly. Alternatively, email editorial-team (at) simplywallst.com.
This article by Simply Wall St is general in nature. We provide commentary based on historical data and analyst forecasts only using an unbiased methodology and our articles are not intended to be financial advice. It does not constitute a recommendation to buy or sell any stock, and does not take account of your objectives, or your financial situation. We aim to bring you long-term focused analysis driven by fundamental data. Note that our analysis may not factor in the latest price-sensitive company announcements or qualitative material. Simply Wall St has no position in any stocks mentioned.
Have feedback on this article? Concerned about the content? Get in touch with us directly. Alternatively, email editorial-team@simplywallst.com
