
 Yahoo Finance
 Investors Could Be Concerned With Forward Industries' (NASDAQ:FORD) Returns On Capital
There are a few key trends to look for if we want to identify the next multi-bagger. One common approach is to try and find a company with returns on capital employed (ROCE) that are increasing, in conjunction with a growing amount of capital employed. Ultimately, this demonstrates that it's a business that is reinvesting profits at increasing rates of return. However, after briefly looking over the numbers, we don't think Forward Industries (NASDAQ:FORD) has the makings of a multi-bagger going forward, but let's have a look at why that may be.
What is Return On Capital Employed (ROCE)?
Just to clarify if you're unsure, ROCE is a metric for evaluating how much pre-tax income (in percentage terms) a company earns on the capital invested in its business. To calculate this metric for Forward Industries, this is the formula:
Return on Capital Employed = Earnings Before Interest and Tax (EBIT) ÷ (Total Assets - Current Liabilities)
0.01 = US$110k ÷ (US$22m - US$11m) (Based on the trailing twelve months to March 2022).
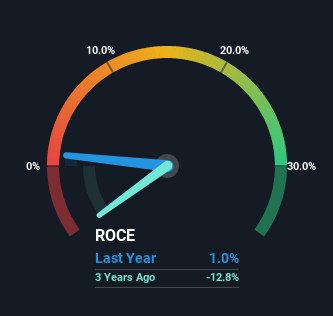
So, Forward Industries has an ROCE of 1.0%. In absolute terms, that's a low return and it also under-performs the Luxury industry average of 14%.
See our latest analysis for Forward Industries
While the past is not representative of the future, it can be helpful to know how a company has performed historically, which is why we have this chart above. If you're interested in investigating Forward Industries' past further, check out this free graph of past earnings, revenue and cash flow.
What The Trend Of ROCE Can Tell Us
On the surface, the trend of ROCE at Forward Industries doesn't inspire confidence. Around five years ago the returns on capital were 1.7%, but since then they've fallen to 1.0%. Although, given both revenue and the amount of assets employed in the business have increased, it could suggest the company is investing in growth, and the extra capital has led to a short-term reduction in ROCE. If these investments prove successful, this can bode very well for long term stock performance.
While on the subject, we noticed that the ratio of current liabilities to total assets has risen to 50%, which has impacted the ROCE. If current liabilities hadn't increased as much as they did, the ROCE could actually be even lower. What this means is that in reality, a rather large portion of the business is being funded by the likes of the company's suppliers or short-term creditors, which can bring some risks of its own.
Our Take On Forward Industries' ROCE
Even though returns on capital have fallen in the short term, we find it promising that revenue and capital employed have both increased for Forward Industries. In light of this, the stock has only gained 33% over the last five years. So this stock may still be an appealing investment opportunity, if other fundamentals prove to be sound.
One final note, you should learn about the 3 warning signs we've spotted with Forward Industries (including 1 which is significant) .
While Forward Industries may not currently earn the highest returns, we've compiled a list of companies that currently earn more than 25% return on equity. Check out this free list here.
Have feedback on this article? Concerned about the content? Get in touch with us directly. Alternatively, email editorial-team (at) simplywallst.com.
This article by Simply Wall St is general in nature. We provide commentary based on historical data and analyst forecasts only using an unbiased methodology and our articles are not intended to be financial advice. It does not constitute a recommendation to buy or sell any stock, and does not take account of your objectives, or your financial situation. We aim to bring you long-term focused analysis driven by fundamental data. Note that our analysis may not factor in the latest price-sensitive company announcements or qualitative material. Simply Wall St has no position in any stocks mentioned.
