
 Yahoo Finance
 Investors Could Be Concerned With Globe International's (ASX:GLB) Returns On Capital
Finding a business that has the potential to grow substantially is not easy, but it is possible if we look at a few key financial metrics. Firstly, we'd want to identify a growing return on capital employed (ROCE) and then alongside that, an ever-increasing base of capital employed. If you see this, it typically means it's a company with a great business model and plenty of profitable reinvestment opportunities. However, after investigating Globe International (ASX:GLB), we don't think it's current trends fit the mold of a multi-bagger.
Return On Capital Employed (ROCE): What Is It?
Just to clarify if you're unsure, ROCE is a metric for evaluating how much pre-tax income (in percentage terms) a company earns on the capital invested in its business. The formula for this calculation on Globe International is:
Return on Capital Employed = Earnings Before Interest and Tax (EBIT) ÷ (Total Assets - Current Liabilities)
0.051 = AU$4.6m ÷ (AU$127m - AU$36m) (Based on the trailing twelve months to June 2023).
So, Globe International has an ROCE of 5.1%. In absolute terms, that's a low return and it also under-performs the Luxury industry average of 9.3%.
See our latest analysis for Globe International
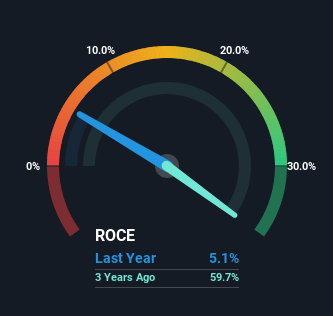
Historical performance is a great place to start when researching a stock so above you can see the gauge for Globe International's ROCE against it's prior returns. If you want to delve into the historical earnings, revenue and cash flow of Globe International, check out these free graphs here.
So How Is Globe International's ROCE Trending?
When we looked at the ROCE trend at Globe International, we didn't gain much confidence. Around five years ago the returns on capital were 20%, but since then they've fallen to 5.1%. Given the business is employing more capital while revenue has slipped, this is a bit concerning. This could mean that the business is losing its competitive advantage or market share, because while more money is being put into ventures, it's actually producing a lower return - "less bang for their buck" per se.
On a related note, Globe International has decreased its current liabilities to 29% of total assets. That could partly explain why the ROCE has dropped. What's more, this can reduce some aspects of risk to the business because now the company's suppliers or short-term creditors are funding less of its operations. Some would claim this reduces the business' efficiency at generating ROCE since it is now funding more of the operations with its own money.
In Conclusion...
In summary, we're somewhat concerned by Globe International's diminishing returns on increasing amounts of capital. However the stock has delivered a 83% return to shareholders over the last five years, so investors might be expecting the trends to turn around. In any case, the current underlying trends don't bode well for long term performance so unless they reverse, we'd start looking elsewhere.
One more thing to note, we've identified 2 warning signs with Globe International and understanding them should be part of your investment process.
For those who like to invest in solid companies, check out this free list of companies with solid balance sheets and high returns on equity.
Have feedback on this article? Concerned about the content? Get in touch with us directly. Alternatively, email editorial-team (at) simplywallst.com.
This article by Simply Wall St is general in nature. We provide commentary based on historical data and analyst forecasts only using an unbiased methodology and our articles are not intended to be financial advice. It does not constitute a recommendation to buy or sell any stock, and does not take account of your objectives, or your financial situation. We aim to bring you long-term focused analysis driven by fundamental data. Note that our analysis may not factor in the latest price-sensitive company announcements or qualitative material. Simply Wall St has no position in any stocks mentioned.
