
 Yahoo Finance
 Investors Could Be Concerned With Goodwin's (LON:GDWN) Returns On Capital
To avoid investing in a business that's in decline, there's a few financial metrics that can provide early indications of aging. Typically, we'll see the trend of both return on capital employed (ROCE) declining and this usually coincides with a decreasing amount of capital employed. This indicates to us that the business is not only shrinking the size of its net assets, but its returns are falling as well. So after glancing at the trends within Goodwin (LON:GDWN), we weren't too hopeful.
Return On Capital Employed (ROCE): What is it?
For those that aren't sure what ROCE is, it measures the amount of pre-tax profits a company can generate from the capital employed in its business. To calculate this metric for Goodwin, this is the formula:
Return on Capital Employed = Earnings Before Interest and Tax (EBIT) ÷ (Total Assets - Current Liabilities)
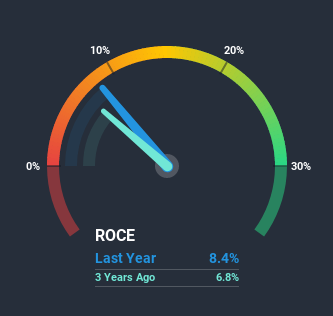
0.084 = UK£10m ÷ (UK£210m - UK£86m) (Based on the trailing twelve months to October 2020).
Thus, Goodwin has an ROCE of 8.4%. On its own, that's a low figure but it's around the 8.9% average generated by the Machinery industry.
See our latest analysis for Goodwin
While the past is not representative of the future, it can be helpful to know how a company has performed historically, which is why we have this chart above. If you're interested in investigating Goodwin's past further, check out this free graph of past earnings, revenue and cash flow.
What Can We Tell From Goodwin's ROCE Trend?
There is reason to be cautious about Goodwin, given the returns are trending downwards. About five years ago, returns on capital were 12%, however they're now substantially lower than that as we saw above. And on the capital employed front, the business is utilizing roughly the same amount of capital as it was back then. Companies that exhibit these attributes tend to not be shrinking, but they can be mature and facing pressure on their margins from competition. If these trends continue, we wouldn't expect Goodwin to turn into a multi-bagger.
While on the subject, we noticed that the ratio of current liabilities to total assets has risen to 41%, which has impacted the ROCE. If current liabilities hadn't increased as much as they did, the ROCE could actually be even lower. And with current liabilities at these levels, suppliers or short-term creditors are effectively funding a large part of the business, which can introduce some risks.
What We Can Learn From Goodwin's ROCE
In summary, it's unfortunate that Goodwin is generating lower returns from the same amount of capital. Yet despite these concerning fundamentals, the stock has performed strongly with a 65% return over the last five years, so investors appear very optimistic. Regardless, we don't feel too comfortable with the fundamentals so we'd be steering clear of this stock for now.
On a final note, we've found 2 warning signs for Goodwin that we think you should be aware of.
While Goodwin isn't earning the highest return, check out this free list of companies that are earning high returns on equity with solid balance sheets.
This article by Simply Wall St is general in nature. It does not constitute a recommendation to buy or sell any stock, and does not take account of your objectives, or your financial situation. We aim to bring you long-term focused analysis driven by fundamental data. Note that our analysis may not factor in the latest price-sensitive company announcements or qualitative material. Simply Wall St has no position in any stocks mentioned.
Have feedback on this article? Concerned about the content? Get in touch with us directly. Alternatively, email editorial-team (at) simplywallst.com.
