
 Yahoo Finance
 Investors Could Be Concerned With Johnson Matthey's (LON:JMAT) Returns On Capital
If we're looking to avoid a business that is in decline, what are the trends that can warn us ahead of time? Businesses in decline often have two underlying trends, firstly, a declining return on capital employed (ROCE) and a declining base of capital employed. This indicates the company is producing less profit from its investments and its total assets are decreasing. In light of that, from a first glance at Johnson Matthey (LON:JMAT), we've spotted some signs that it could be struggling, so let's investigate.
Understanding Return On Capital Employed (ROCE)
Just to clarify if you're unsure, ROCE is a metric for evaluating how much pre-tax income (in percentage terms) a company earns on the capital invested in its business. Analysts use this formula to calculate it for Johnson Matthey:
Return on Capital Employed = Earnings Before Interest and Tax (EBIT) ÷ (Total Assets - Current Liabilities)
0.12 = UK£442m ÷ (UK£6.9b - UK£3.0b) (Based on the trailing twelve months to September 2022).
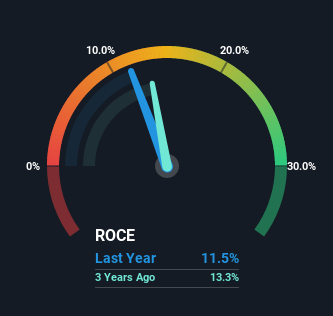
Therefore, Johnson Matthey has an ROCE of 12%. By itself that's a normal return on capital and it's in line with the industry's average returns of 12%.
Check out our latest analysis for Johnson Matthey
In the above chart we have measured Johnson Matthey's prior ROCE against its prior performance, but the future is arguably more important. If you'd like to see what analysts are forecasting going forward, you should check out our free report for Johnson Matthey.
What Does the ROCE Trend For Johnson Matthey Tell Us?
There is reason to be cautious about Johnson Matthey, given the returns are trending downwards. To be more specific, the ROCE was 15% five years ago, but since then it has dropped noticeably. Meanwhile, capital employed in the business has stayed roughly the flat over the period. This combination can be indicative of a mature business that still has areas to deploy capital, but the returns received aren't as high due potentially to new competition or smaller margins. So because these trends aren't typically conducive to creating a multi-bagger, we wouldn't hold our breath on Johnson Matthey becoming one if things continue as they have.
While on the subject, we noticed that the ratio of current liabilities to total assets has risen to 44%, which has impacted the ROCE. Without this increase, it's likely that ROCE would be even lower than 12%. And with current liabilities at these levels, suppliers or short-term creditors are effectively funding a large part of the business, which can introduce some risks.
What We Can Learn From Johnson Matthey's ROCE
In the end, the trend of lower returns on the same amount of capital isn't typically an indication that we're looking at a growth stock. Long term shareholders who've owned the stock over the last five years have experienced a 35% depreciation in their investment, so it appears the market might not like these trends either. Unless there is a shift to a more positive trajectory in these metrics, we would look elsewhere.
Like most companies, Johnson Matthey does come with some risks, and we've found 1 warning sign that you should be aware of.
While Johnson Matthey may not currently earn the highest returns, we've compiled a list of companies that currently earn more than 25% return on equity. Check out this free list here.
Have feedback on this article? Concerned about the content? Get in touch with us directly. Alternatively, email editorial-team (at) simplywallst.com.
This article by Simply Wall St is general in nature. We provide commentary based on historical data and analyst forecasts only using an unbiased methodology and our articles are not intended to be financial advice. It does not constitute a recommendation to buy or sell any stock, and does not take account of your objectives, or your financial situation. We aim to bring you long-term focused analysis driven by fundamental data. Note that our analysis may not factor in the latest price-sensitive company announcements or qualitative material. Simply Wall St has no position in any stocks mentioned.
Join A Paid User Research Session
You’ll receive a US$30 Amazon Gift card for 1 hour of your time while helping us build better investing tools for the individual investors like yourself. Sign up here
