
 Yahoo Finance
 Investors Could Be Concerned With KAP's (ETR:IUR) Returns On Capital
If we're looking to avoid a business that is in decline, what are the trends that can warn us ahead of time? Typically, we'll see the trend of both return on capital employed (ROCE) declining and this usually coincides with a decreasing amount of capital employed. This reveals that the company isn't compounding shareholder wealth because returns are falling and its net asset base is shrinking. So after we looked into KAP (ETR:IUR), the trends above didn't look too great.
Understanding Return On Capital Employed (ROCE)
For those who don't know, ROCE is a measure of a company's yearly pre-tax profit (its return), relative to the capital employed in the business. To calculate this metric for KAP, this is the formula:
Return on Capital Employed = Earnings Before Interest and Tax (EBIT) ÷ (Total Assets - Current Liabilities)
0.016 = €3.1m ÷ (€317m - €130m) (Based on the trailing twelve months to December 2023).
So, KAP has an ROCE of 1.6%. Ultimately, that's a low return and it under-performs the Industrials industry average of 6.8%.
Check out our latest analysis for KAP
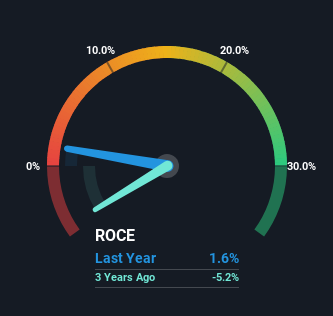
Historical performance is a great place to start when researching a stock so above you can see the gauge for KAP's ROCE against it's prior returns. If you're interested in investigating KAP's past further, check out this free graph covering KAP's past earnings, revenue and cash flow.
How Are Returns Trending?
We are a bit anxious about the trends of ROCE at KAP. Unfortunately, returns have declined substantially over the last five years to the 1.6% we see today. In addition to that, KAP is now employing 34% less capital than it was five years ago. The fact that both are shrinking is an indication that the business is going through some tough times. If these underlying trends continue, we wouldn't be too optimistic going forward.
While on the subject, we noticed that the ratio of current liabilities to total assets has risen to 41%, which has impacted the ROCE. If current liabilities hadn't increased as much as they did, the ROCE could actually be even lower. What this means is that in reality, a rather large portion of the business is being funded by the likes of the company's suppliers or short-term creditors, which can bring some risks of its own.
Our Take On KAP's ROCE
To see KAP reducing the capital employed in the business in tandem with diminishing returns, is concerning. Long term shareholders who've owned the stock over the last five years have experienced a 63% depreciation in their investment, so it appears the market might not like these trends either. Unless there is a shift to a more positive trajectory in these metrics, we would look elsewhere.
On a final note, we've found 2 warning signs for KAP that we think you should be aware of.
If you want to search for solid companies with great earnings, check out this free list of companies with good balance sheets and impressive returns on equity.
Have feedback on this article? Concerned about the content? Get in touch with us directly. Alternatively, email editorial-team (at) simplywallst.com.
This article by Simply Wall St is general in nature. We provide commentary based on historical data and analyst forecasts only using an unbiased methodology and our articles are not intended to be financial advice. It does not constitute a recommendation to buy or sell any stock, and does not take account of your objectives, or your financial situation. We aim to bring you long-term focused analysis driven by fundamental data. Note that our analysis may not factor in the latest price-sensitive company announcements or qualitative material. Simply Wall St has no position in any stocks mentioned.
