
 Yahoo Finance
 Investors Could Be Concerned With Portmeirion Group's (LON:PMP) Returns On Capital
Finding a business that has the potential to grow substantially is not easy, but it is possible if we look at a few key financial metrics. In a perfect world, we'd like to see a company investing more capital into its business and ideally the returns earned from that capital are also increasing. This shows us that it's a compounding machine, able to continually reinvest its earnings back into the business and generate higher returns. However, after briefly looking over the numbers, we don't think Portmeirion Group (LON:PMP) has the makings of a multi-bagger going forward, but let's have a look at why that may be.
Return On Capital Employed (ROCE): What is it?
Just to clarify if you're unsure, ROCE is a metric for evaluating how much pre-tax income (in percentage terms) a company earns on the capital invested in its business. The formula for this calculation on Portmeirion Group is:
Return on Capital Employed = Earnings Before Interest and Tax (EBIT) ÷ (Total Assets - Current Liabilities)
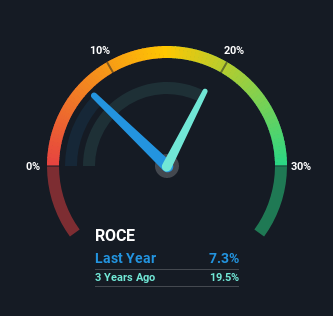
0.073 = UK£5.2m ÷ (UK£88m - UK£17m) (Based on the trailing twelve months to June 2021).
Therefore, Portmeirion Group has an ROCE of 7.3%. In absolute terms, that's a low return and it also under-performs the Consumer Durables industry average of 9.6%.
See our latest analysis for Portmeirion Group
In the above chart we have measured Portmeirion Group's prior ROCE against its prior performance, but the future is arguably more important. If you'd like to see what analysts are forecasting going forward, you should check out our free report for Portmeirion Group.
The Trend Of ROCE
In terms of Portmeirion Group's historical ROCE movements, the trend isn't fantastic. Over the last five years, returns on capital have decreased to 7.3% from 17% five years ago. However, given capital employed and revenue have both increased it appears that the business is currently pursuing growth, at the consequence of short term returns. And if the increased capital generates additional returns, the business, and thus shareholders, will benefit in the long run.
The Bottom Line
In summary, despite lower returns in the short term, we're encouraged to see that Portmeirion Group is reinvesting for growth and has higher sales as a result. However, despite the promising trends, the stock has fallen 27% over the last five years, so there might be an opportunity here for astute investors. As a result, we'd recommend researching this stock further to uncover what other fundamentals of the business can show us.
Portmeirion Group could be trading at an attractive price in other respects, so you might find our free intrinsic value estimation on our platform quite valuable.
If you want to search for solid companies with great earnings, check out this free list of companies with good balance sheets and impressive returns on equity.
Have feedback on this article? Concerned about the content? Get in touch with us directly. Alternatively, email editorial-team (at) simplywallst.com.
This article by Simply Wall St is general in nature. We provide commentary based on historical data and analyst forecasts only using an unbiased methodology and our articles are not intended to be financial advice. It does not constitute a recommendation to buy or sell any stock, and does not take account of your objectives, or your financial situation. We aim to bring you long-term focused analysis driven by fundamental data. Note that our analysis may not factor in the latest price-sensitive company announcements or qualitative material. Simply Wall St has no position in any stocks mentioned.
