
 Yahoo Finance
 Investors Could Be Concerned With Rambus' (NASDAQ:RMBS) Returns On Capital
When it comes to investing, there are some useful financial metrics that can warn us when a business is potentially in trouble. Businesses in decline often have two underlying trends, firstly, a declining return on capital employed (ROCE) and a declining base of capital employed. This reveals that the company isn't compounding shareholder wealth because returns are falling and its net asset base is shrinking. In light of that, from a first glance at Rambus (NASDAQ:RMBS), we've spotted some signs that it could be struggling, so let's investigate.
Return On Capital Employed (ROCE): What is it?
If you haven't worked with ROCE before, it measures the 'return' (pre-tax profit) a company generates from capital employed in its business. To calculate this metric for Rambus, this is the formula:
Return on Capital Employed = Earnings Before Interest and Tax (EBIT) ÷ (Total Assets - Current Liabilities)
0.051 = US$46m ÷ (US$1.1b - US$168m) (Based on the trailing twelve months to March 2022).
So, Rambus has an ROCE of 5.1%. Ultimately, that's a low return and it under-performs the Semiconductor industry average of 14%.
Check out our latest analysis for Rambus
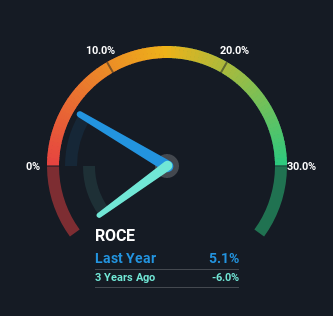
Above you can see how the current ROCE for Rambus compares to its prior returns on capital, but there's only so much you can tell from the past. If you'd like to see what analysts are forecasting going forward, you should check out our free report for Rambus.
What The Trend Of ROCE Can Tell Us
In terms of Rambus' historical ROCE movements, the trend doesn't inspire confidence. To be more specific, the ROCE was 6.7% five years ago, but since then it has dropped noticeably. And on the capital employed front, the business is utilizing roughly the same amount of capital as it was back then. Companies that exhibit these attributes tend to not be shrinking, but they can be mature and facing pressure on their margins from competition. So because these trends aren't typically conducive to creating a multi-bagger, we wouldn't hold our breath on Rambus becoming one if things continue as they have.
While on the subject, we noticed that the ratio of current liabilities to total assets has risen to 16%, which has impacted the ROCE. If current liabilities hadn't increased as much as they did, the ROCE could actually be even lower. While the ratio isn't currently too high, it's worth keeping an eye on this because if it gets particularly high, the business could then face some new elements of risk.
The Bottom Line
In summary, it's unfortunate that Rambus is generating lower returns from the same amount of capital. Yet despite these concerning fundamentals, the stock has performed strongly with a 99% return over the last five years, so investors appear very optimistic. Regardless, we don't feel too comfortable with the fundamentals so we'd be steering clear of this stock for now.
Like most companies, Rambus does come with some risks, and we've found 1 warning sign that you should be aware of.
While Rambus may not currently earn the highest returns, we've compiled a list of companies that currently earn more than 25% return on equity. Check out this free list here.
Have feedback on this article? Concerned about the content? Get in touch with us directly. Alternatively, email editorial-team (at) simplywallst.com.
This article by Simply Wall St is general in nature. We provide commentary based on historical data and analyst forecasts only using an unbiased methodology and our articles are not intended to be financial advice. It does not constitute a recommendation to buy or sell any stock, and does not take account of your objectives, or your financial situation. We aim to bring you long-term focused analysis driven by fundamental data. Note that our analysis may not factor in the latest price-sensitive company announcements or qualitative material. Simply Wall St has no position in any stocks mentioned.
