
 Yahoo Finance
 Investors Could Be Concerned With Severn Trent's (LON:SVT) Returns On Capital
If you're looking for a multi-bagger, there's a few things to keep an eye out for. Ideally, a business will show two trends; firstly a growing return on capital employed (ROCE) and secondly, an increasing amount of capital employed. Basically this means that a company has profitable initiatives that it can continue to reinvest in, which is a trait of a compounding machine. In light of that, when we looked at Severn Trent (LON:SVT) and its ROCE trend, we weren't exactly thrilled.
Understanding Return On Capital Employed (ROCE)
Just to clarify if you're unsure, ROCE is a metric for evaluating how much pre-tax income (in percentage terms) a company earns on the capital invested in its business. To calculate this metric for Severn Trent, this is the formula:
Return on Capital Employed = Earnings Before Interest and Tax (EBIT) ÷ (Total Assets - Current Liabilities)
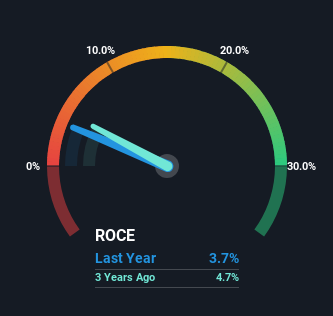
0.037 = UK£496m ÷ (UK£14b - UK£847m) (Based on the trailing twelve months to March 2024).
So, Severn Trent has an ROCE of 3.7%. On its own that's a low return, but compared to the average of 1.3% generated by the Water Utilities industry, it's much better.
View our latest analysis for Severn Trent
In the above chart we have measured Severn Trent's prior ROCE against its prior performance, but the future is arguably more important. If you're interested, you can view the analysts predictions in our free analyst report for Severn Trent .
What Can We Tell From Severn Trent's ROCE Trend?
When we looked at the ROCE trend at Severn Trent, we didn't gain much confidence. To be more specific, ROCE has fallen from 5.9% over the last five years. However it looks like Severn Trent might be reinvesting for long term growth because while capital employed has increased, the company's sales haven't changed much in the last 12 months. It's worth keeping an eye on the company's earnings from here on to see if these investments do end up contributing to the bottom line.
The Bottom Line On Severn Trent's ROCE
Bringing it all together, while we're somewhat encouraged by Severn Trent's reinvestment in its own business, we're aware that returns are shrinking. Although the market must be expecting these trends to improve because the stock has gained 46% over the last five years. But if the trajectory of these underlying trends continue, we think the likelihood of it being a multi-bagger from here isn't high.
On a final note, we found 3 warning signs for Severn Trent (2 make us uncomfortable) you should be aware of.
While Severn Trent isn't earning the highest return, check out this free list of companies that are earning high returns on equity with solid balance sheets.
Have feedback on this article? Concerned about the content? Get in touch with us directly. Alternatively, email editorial-team (at) simplywallst.com.
This article by Simply Wall St is general in nature. We provide commentary based on historical data and analyst forecasts only using an unbiased methodology and our articles are not intended to be financial advice. It does not constitute a recommendation to buy or sell any stock, and does not take account of your objectives, or your financial situation. We aim to bring you long-term focused analysis driven by fundamental data. Note that our analysis may not factor in the latest price-sensitive company announcements or qualitative material. Simply Wall St has no position in any stocks mentioned.
Have feedback on this article? Concerned about the content? Get in touch with us directly. Alternatively, email editorial-team@simplywallst.com
