
 Yahoo Finance
 Investors in Dun & Bradstreet Holdings (NYSE:DNB) have unfortunately lost 28% over the last year
The simplest way to benefit from a rising market is to buy an index fund. But if you buy individual stocks, you can do both better or worse than that. Investors in Dun & Bradstreet Holdings, Inc. (NYSE:DNB) have tasted that bitter downside in the last year, as the share price dropped 28%. That's well below the market return of 22%. Dun & Bradstreet Holdings may have better days ahead, of course; we've only looked at a one year period. Even worse, it's down 8.2% in about a month, which isn't fun at all. But this could be related to poor market conditions -- stocks are down 3.6% in the same time.
Now let's have a look at the company's fundamentals, and see if the long term shareholder return has matched the performance of the underlying business.
Check out our latest analysis for Dun & Bradstreet Holdings
There is no denying that markets are sometimes efficient, but prices do not always reflect underlying business performance. One flawed but reasonable way to assess how sentiment around a company has changed is to compare the earnings per share (EPS) with the share price.
During the unfortunate twelve months during which the Dun & Bradstreet Holdings share price fell, it actually saw its earnings per share (EPS) improve by 88%. It could be that the share price was previously over-hyped. Extraordinary items have impacted profits over the last twelve months.
The divergence between the EPS and the share price is quite notable, during the year. So it's easy to justify a look at some other metrics.
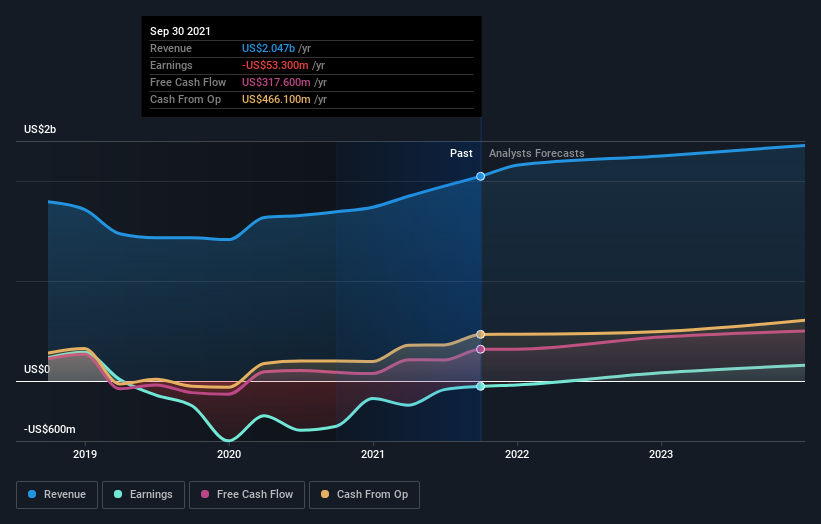
Dun & Bradstreet Holdings managed to grow revenue over the last year, which is usually a real positive. Since the fundamental metrics don't readily explain the share price drop, there might be an opportunity if the market has overreacted.
You can see below how earnings and revenue have changed over time (discover the exact values by clicking on the image).
We consider it positive that insiders have made significant purchases in the last year. Having said that, most people consider earnings and revenue growth trends to be a more meaningful guide to the business. You can see what analysts are predicting for Dun & Bradstreet Holdings in this interactive graph of future profit estimates.
A Different Perspective
Given that the market gained 22% in the last year, Dun & Bradstreet Holdings shareholders might be miffed that they lost 28%. While the aim is to do better than that, it's worth recalling that even great long-term investments sometimes underperform for a year or more. It's great to see a nice little 5.7% rebound in the last three months. This could just be a bounce because the selling was too aggressive, but fingers crossed it's the start of a new trend. It's always interesting to track share price performance over the longer term. But to understand Dun & Bradstreet Holdings better, we need to consider many other factors. Even so, be aware that Dun & Bradstreet Holdings is showing 1 warning sign in our investment analysis , you should know about...
Dun & Bradstreet Holdings is not the only stock insiders are buying. So take a peek at this free list of growing companies with insider buying.
Please note, the market returns quoted in this article reflect the market weighted average returns of stocks that currently trade on US exchanges.
Have feedback on this article? Concerned about the content? Get in touch with us directly. Alternatively, email editorial-team (at) simplywallst.com.
This article by Simply Wall St is general in nature. We provide commentary based on historical data and analyst forecasts only using an unbiased methodology and our articles are not intended to be financial advice. It does not constitute a recommendation to buy or sell any stock, and does not take account of your objectives, or your financial situation. We aim to bring you long-term focused analysis driven by fundamental data. Note that our analysis may not factor in the latest price-sensitive company announcements or qualitative material. Simply Wall St has no position in any stocks mentioned.
