
 Yahoo Finance
 Investors in E.ON (ETR:EOAN) have unfortunately lost 12% over the last year
It's easy to feel disappointed if you buy a stock that goes down. But often it is not a reflection of the fundamental business performance. The E.ON SE (ETR:EOAN) is down 16% over a year, but the total shareholder return is -12% once you include the dividend. That's better than the market which declined 13% over the last year. On the other hand, the stock is actually up 1.4% over three years.
It's worthwhile assessing if the company's economics have been moving in lockstep with these underwhelming shareholder returns, or if there is some disparity between the two. So let's do just that.
See our latest analysis for E.ON
While the efficient markets hypothesis continues to be taught by some, it has been proven that markets are over-reactive dynamic systems, and investors are not always rational. By comparing earnings per share (EPS) and share price changes over time, we can get a feel for how investor attitudes to a company have morphed over time.
During the unfortunate twelve months during which the E.ON share price fell, it actually saw its earnings per share (EPS) improve by 20%. Of course, the situation might betray previous over-optimism about growth.
It's fair to say that the share price does not seem to be reflecting the EPS growth. So it's well worth checking out some other metrics, too.
We don't see any weakness in the E.ON's dividend so the steady payout can't really explain the share price drop. From what we can see, revenue is pretty flat, so that doesn't really explain the share price drop. Unless, of course, the market was expecting a revenue uptick.
You can see below how earnings and revenue have changed over time (discover the exact values by clicking on the image).
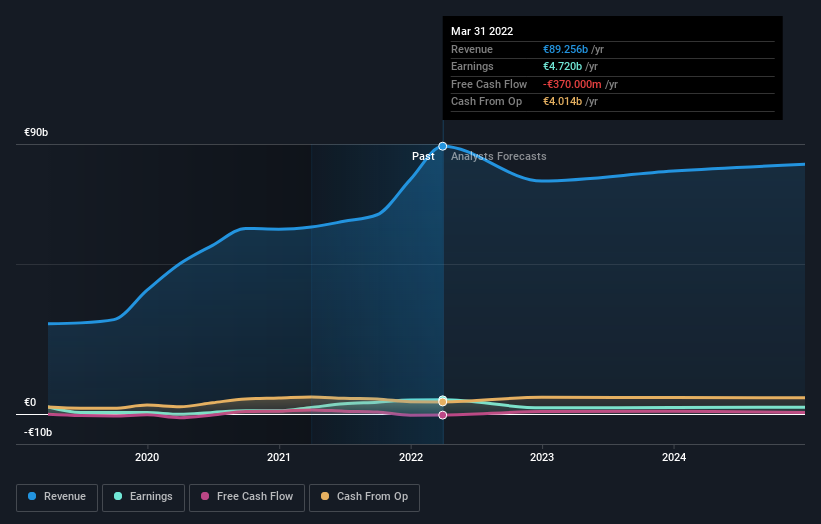
E.ON is a well known stock, with plenty of analyst coverage, suggesting some visibility into future growth. You can see what analysts are predicting for E.ON in this interactive graph of future profit estimates.
What About Dividends?
It is important to consider the total shareholder return, as well as the share price return, for any given stock. The TSR incorporates the value of any spin-offs or discounted capital raisings, along with any dividends, based on the assumption that the dividends are reinvested. Arguably, the TSR gives a more comprehensive picture of the return generated by a stock. In the case of E.ON, it has a TSR of -12% for the last 1 year. That exceeds its share price return that we previously mentioned. The dividends paid by the company have thusly boosted the total shareholder return.
A Different Perspective
While it's never nice to take a loss, E.ON shareholders can take comfort that , including dividends,their trailing twelve month loss of 12% wasn't as bad as the market loss of around 13%. Of course, the long term returns are far more important and the good news is that over five years, the stock has returned 4% for each year. In the best case scenario the last year is just a temporary blip on the journey to a brighter future. It's always interesting to track share price performance over the longer term. But to understand E.ON better, we need to consider many other factors. Take risks, for example - E.ON has 3 warning signs (and 2 which don't sit too well with us) we think you should know about.
But note: E.ON may not be the best stock to buy. So take a peek at this free list of interesting companies with past earnings growth (and further growth forecast).
Please note, the market returns quoted in this article reflect the market weighted average returns of stocks that currently trade on DE exchanges.
Have feedback on this article? Concerned about the content? Get in touch with us directly. Alternatively, email editorial-team (at) simplywallst.com.
This article by Simply Wall St is general in nature. We provide commentary based on historical data and analyst forecasts only using an unbiased methodology and our articles are not intended to be financial advice. It does not constitute a recommendation to buy or sell any stock, and does not take account of your objectives, or your financial situation. We aim to bring you long-term focused analysis driven by fundamental data. Note that our analysis may not factor in the latest price-sensitive company announcements or qualitative material. Simply Wall St has no position in any stocks mentioned.
Join A Paid User Research Session
You’ll receive a US$30 Amazon Gift card for 1 hour of your time while helping us build better investing tools for the individual investors like yourself. Sign up here
