
 Yahoo Finance
 Investors in EQS Group (ETR:EQS) have seen solid returns of 184% over the past five years
The worst result, after buying shares in a company (assuming no leverage), would be if you lose all the money you put in. But on a lighter note, a good company can see its share price rise well over 100%. For instance, the price of EQS Group AG (ETR:EQS) stock is up an impressive 184% over the last five years.
With that in mind, it's worth seeing if the company's underlying fundamentals have been the driver of long term performance, or if there are some discrepancies.
View our latest analysis for EQS Group
Given that EQS Group didn't make a profit in the last twelve months, we'll focus on revenue growth to form a quick view of its business development. When a company doesn't make profits, we'd generally hope to see good revenue growth. That's because it's hard to be confident a company will be sustainable if revenue growth is negligible, and it never makes a profit.
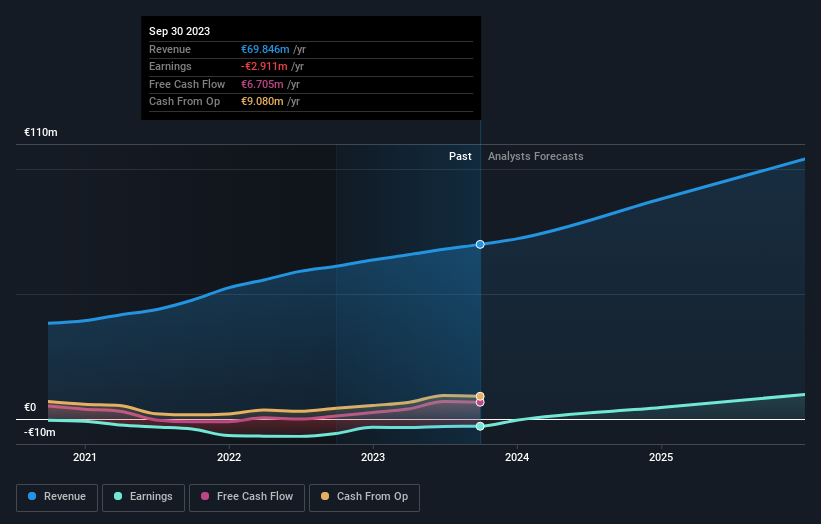
For the last half decade, EQS Group can boast revenue growth at a rate of 18% per year. Even measured against other revenue-focussed companies, that's a good result. Meanwhile, its share price performance certainly reflects the strong growth, given the share price grew at 23% per year, compound, during the period. This suggests the market has well and truly recognized the progress the business has made. To our minds that makes EQS Group worth investigating - it may have its best days ahead.
The graphic below depicts how earnings and revenue have changed over time (unveil the exact values by clicking on the image).
Balance sheet strength is crucial. It might be well worthwhile taking a look at our free report on how its financial position has changed over time.
A Different Perspective
We're pleased to report that EQS Group shareholders have received a total shareholder return of 74% over one year. Since the one-year TSR is better than the five-year TSR (the latter coming in at 23% per year), it would seem that the stock's performance has improved in recent times. Given the share price momentum remains strong, it might be worth taking a closer look at the stock, lest you miss an opportunity. You could get a better understanding of EQS Group's growth by checking out this more detailed historical graph of earnings, revenue and cash flow.
But note: EQS Group may not be the best stock to buy. So take a peek at this free list of interesting companies with past earnings growth (and further growth forecast).
Please note, the market returns quoted in this article reflect the market weighted average returns of stocks that currently trade on German exchanges.
Have feedback on this article? Concerned about the content? Get in touch with us directly. Alternatively, email editorial-team (at) simplywallst.com.
This article by Simply Wall St is general in nature. We provide commentary based on historical data and analyst forecasts only using an unbiased methodology and our articles are not intended to be financial advice. It does not constitute a recommendation to buy or sell any stock, and does not take account of your objectives, or your financial situation. We aim to bring you long-term focused analysis driven by fundamental data. Note that our analysis may not factor in the latest price-sensitive company announcements or qualitative material. Simply Wall St has no position in any stocks mentioned.
