
 Yahoo Finance
 Investors five-year returns in Lancashire Holdings (LON:LRE) have not grown faster than the company's underlying earnings growth
The main aim of stock picking is to find the market-beating stocks. But even the best stock picker will only win with some selections. At this point some shareholders may be questioning their investment in Lancashire Holdings Limited (LON:LRE), since the last five years saw the share price fall 11%. Unfortunately the last month hasn't been any better, with the share price down 11%. Importantly, this could be a market reaction to the recently released financial results. You can check out the latest numbers in our company report.
With the stock having lost 4.0% in the past week, it's worth taking a look at business performance and seeing if there's any red flags.
Check out our latest analysis for Lancashire Holdings
There is no denying that markets are sometimes efficient, but prices do not always reflect underlying business performance. One way to examine how market sentiment has changed over time is to look at the interaction between a company's share price and its earnings per share (EPS).
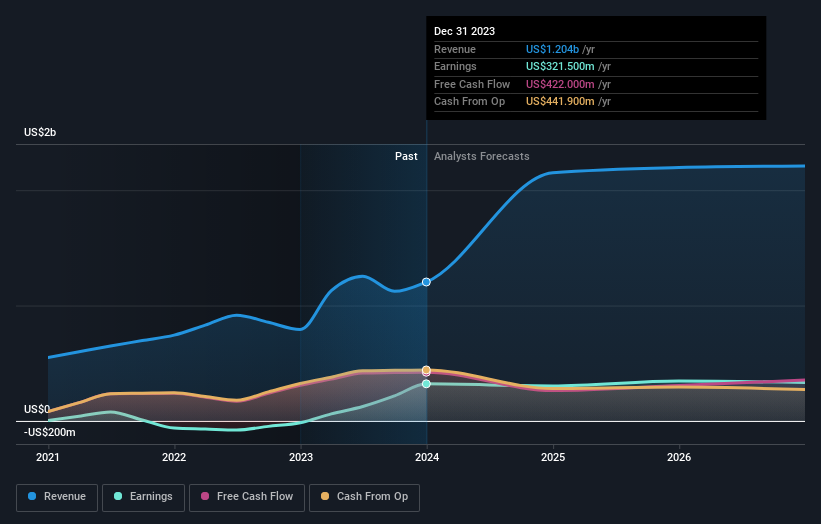
Lancashire Holdings became profitable within the last five years. That would generally be considered a positive, so we are surprised to see the share price is down. Other metrics may better explain the share price move.
Revenue is actually up 23% over the time period. A more detailed examination of the revenue and earnings may or may not explain why the share price languishes; there could be an opportunity.
The graphic below depicts how earnings and revenue have changed over time (unveil the exact values by clicking on the image).
We know that Lancashire Holdings has improved its bottom line over the last three years, but what does the future have in store? If you are thinking of buying or selling Lancashire Holdings stock, you should check out this FREE detailed report on its balance sheet.
What About Dividends?
It is important to consider the total shareholder return, as well as the share price return, for any given stock. The TSR incorporates the value of any spin-offs or discounted capital raisings, along with any dividends, based on the assumption that the dividends are reinvested. Arguably, the TSR gives a more comprehensive picture of the return generated by a stock. As it happens, Lancashire Holdings' TSR for the last 5 years was 10%, which exceeds the share price return mentioned earlier. And there's no prize for guessing that the dividend payments largely explain the divergence!
A Different Perspective
It's nice to see that Lancashire Holdings shareholders have received a total shareholder return of 23% over the last year. That's including the dividend. That's better than the annualised return of 2% over half a decade, implying that the company is doing better recently. Someone with an optimistic perspective could view the recent improvement in TSR as indicating that the business itself is getting better with time. It's always interesting to track share price performance over the longer term. But to understand Lancashire Holdings better, we need to consider many other factors. To that end, you should be aware of the 1 warning sign we've spotted with Lancashire Holdings .
If you would prefer to check out another company -- one with potentially superior financials -- then do not miss this free list of companies that have proven they can grow earnings.
Please note, the market returns quoted in this article reflect the market weighted average returns of stocks that currently trade on British exchanges.
Have feedback on this article? Concerned about the content? Get in touch with us directly. Alternatively, email editorial-team (at) simplywallst.com.
This article by Simply Wall St is general in nature. We provide commentary based on historical data and analyst forecasts only using an unbiased methodology and our articles are not intended to be financial advice. It does not constitute a recommendation to buy or sell any stock, and does not take account of your objectives, or your financial situation. We aim to bring you long-term focused analysis driven by fundamental data. Note that our analysis may not factor in the latest price-sensitive company announcements or qualitative material. Simply Wall St has no position in any stocks mentioned.
