
 Yahoo Finance
 Investors in FRP Holdings (NASDAQ:FRPH) have seen returns of 23% over the past five years
When you buy and hold a stock for the long term, you definitely want it to provide a positive return. Furthermore, you'd generally like to see the share price rise faster than the market. But FRP Holdings, Inc. (NASDAQ:FRPH) has fallen short of that second goal, with a share price rise of 23% over five years, which is below the market return. Zooming in, the stock is up a respectable 7.7% in the last year.
Let's take a look at the underlying fundamentals over the longer term, and see if they've been consistent with shareholders returns.
View our latest analysis for FRP Holdings
To paraphrase Benjamin Graham: Over the short term the market is a voting machine, but over the long term it's a weighing machine. One flawed but reasonable way to assess how sentiment around a company has changed is to compare the earnings per share (EPS) with the share price.
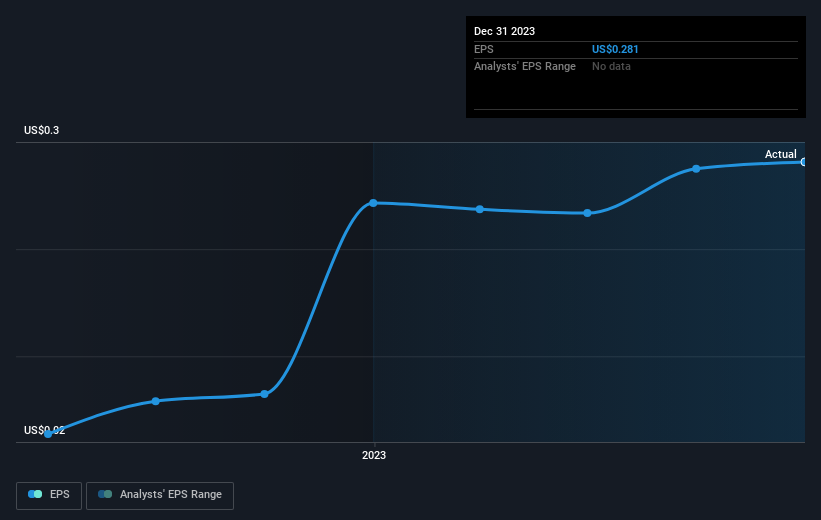
During five years of share price growth, FRP Holdings achieved compound earnings per share (EPS) growth of 19% per year. The EPS growth is more impressive than the yearly share price gain of 4% over the same period. Therefore, it seems the market has become relatively pessimistic about the company. Of course, with a P/E ratio of 109.05, the market remains optimistic.
The company's earnings per share (over time) is depicted in the image below (click to see the exact numbers).
We like that insiders have been buying shares in the last twelve months. Having said that, most people consider earnings and revenue growth trends to be a more meaningful guide to the business. Dive deeper into the earnings by checking this interactive graph of FRP Holdings' earnings, revenue and cash flow.
A Different Perspective
FRP Holdings provided a TSR of 7.7% over the last twelve months. But that return falls short of the market. On the bright side, that's still a gain, and it's actually better than the average return of 4% over half a decade This suggests the company might be improving over time. I find it very interesting to look at share price over the long term as a proxy for business performance. But to truly gain insight, we need to consider other information, too. To that end, you should be aware of the 1 warning sign we've spotted with FRP Holdings .
There are plenty of other companies that have insiders buying up shares. You probably do not want to miss this free list of growing companies that insiders are buying.
Please note, the market returns quoted in this article reflect the market weighted average returns of stocks that currently trade on American exchanges.
Have feedback on this article? Concerned about the content? Get in touch with us directly. Alternatively, email editorial-team (at) simplywallst.com.
This article by Simply Wall St is general in nature. We provide commentary based on historical data and analyst forecasts only using an unbiased methodology and our articles are not intended to be financial advice. It does not constitute a recommendation to buy or sell any stock, and does not take account of your objectives, or your financial situation. We aim to bring you long-term focused analysis driven by fundamental data. Note that our analysis may not factor in the latest price-sensitive company announcements or qualitative material. Simply Wall St has no position in any stocks mentioned.
