
 Yahoo Finance
 Investors in Genting Berhad (KLSE:GENTING) have unfortunately lost 43% over the last five years
For many, the main point of investing is to generate higher returns than the overall market. But every investor is virtually certain to have both over-performing and under-performing stocks. So we wouldn't blame long term Genting Berhad (KLSE:GENTING) shareholders for doubting their decision to hold, with the stock down 52% over a half decade.
Now let's have a look at the company's fundamentals, and see if the long term shareholder return has matched the performance of the underlying business.
Check out our latest analysis for Genting Berhad
While markets are a powerful pricing mechanism, share prices reflect investor sentiment, not just underlying business performance. One flawed but reasonable way to assess how sentiment around a company has changed is to compare the earnings per share (EPS) with the share price.
We know that Genting Berhad has been profitable in the past. On the other hand, it reported a trailing twelve months loss, suggesting it isn't reliably profitable. Other metrics might give us a better handle on how its value is changing over time.
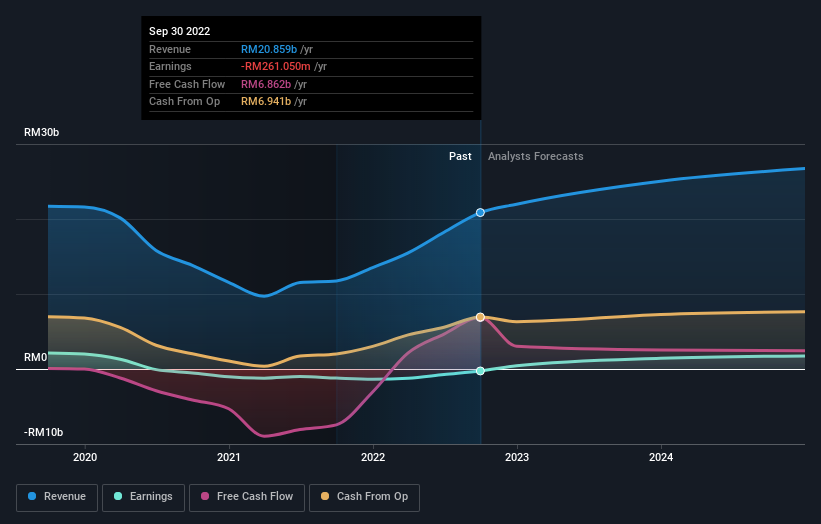
It could be that the revenue decline of 8.5% per year is viewed as evidence that Genting Berhad is shrinking. This has probably encouraged some shareholders to sell down the stock.
The graphic below depicts how earnings and revenue have changed over time (unveil the exact values by clicking on the image).
Genting Berhad is well known by investors, and plenty of clever analysts have tried to predict the future profit levels. So it makes a lot of sense to check out what analysts think Genting Berhad will earn in the future (free analyst consensus estimates)
What About Dividends?
When looking at investment returns, it is important to consider the difference between total shareholder return (TSR) and share price return. The TSR is a return calculation that accounts for the value of cash dividends (assuming that any dividend received was reinvested) and the calculated value of any discounted capital raisings and spin-offs. It's fair to say that the TSR gives a more complete picture for stocks that pay a dividend. As it happens, Genting Berhad's TSR for the last 5 years was -43%, which exceeds the share price return mentioned earlier. This is largely a result of its dividend payments!
A Different Perspective
Genting Berhad shareholders have received returns of 0.6% over twelve months (even including dividends), which isn't far from the general market return. The silver lining is that the share price is up in the short term, which flies in the face of the annualised loss of 7% over the last five years. We're pretty skeptical of turnaround stories, but it's good to see the recent share price recovery. I find it very interesting to look at share price over the long term as a proxy for business performance. But to truly gain insight, we need to consider other information, too. Case in point: We've spotted 1 warning sign for Genting Berhad you should be aware of.
If you are like me, then you will not want to miss this free list of growing companies that insiders are buying.
Please note, the market returns quoted in this article reflect the market weighted average returns of stocks that currently trade on MY exchanges.
Have feedback on this article? Concerned about the content? Get in touch with us directly. Alternatively, email editorial-team (at) simplywallst.com.
This article by Simply Wall St is general in nature. We provide commentary based on historical data and analyst forecasts only using an unbiased methodology and our articles are not intended to be financial advice. It does not constitute a recommendation to buy or sell any stock, and does not take account of your objectives, or your financial situation. We aim to bring you long-term focused analysis driven by fundamental data. Note that our analysis may not factor in the latest price-sensitive company announcements or qualitative material. Simply Wall St has no position in any stocks mentioned.
Join A Paid User Research Session
You’ll receive a US$30 Amazon Gift card for 1 hour of your time while helping us build better investing tools for the individual investors like yourself. Sign up here
