
 Yahoo Finance
 Investors in Greencore Group (LON:GNC) have seen decent returns of 63% over the past year
The simplest way to invest in stocks is to buy exchange traded funds. But investors can boost returns by picking market-beating companies to own shares in. To wit, the Greencore Group plc (LON:GNC) share price is 63% higher than it was a year ago, much better than the market decline of around 0.3% (not including dividends) in the same period. So that should have shareholders smiling. Unfortunately the longer term returns are not so good, with the stock falling 17% in the last three years.
So let's assess the underlying fundamentals over the last 1 year and see if they've moved in lock-step with shareholder returns.
View our latest analysis for Greencore Group
While the efficient markets hypothesis continues to be taught by some, it has been proven that markets are over-reactive dynamic systems, and investors are not always rational. By comparing earnings per share (EPS) and share price changes over time, we can get a feel for how investor attitudes to a company have morphed over time.
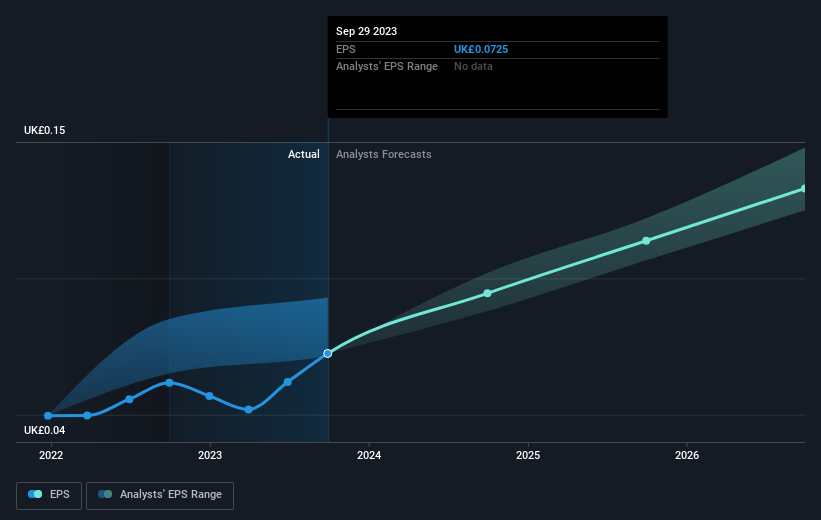
During the last year Greencore Group grew its earnings per share (EPS) by 18%. This EPS growth is significantly lower than the 63% increase in the share price. This indicates that the market is now more optimistic about the stock.
You can see how EPS has changed over time in the image below (click on the chart to see the exact values).
It is of course excellent to see how Greencore Group has grown profits over the years, but the future is more important for shareholders. This free interactive report on Greencore Group's balance sheet strength is a great place to start, if you want to investigate the stock further.
A Different Perspective
It's nice to see that Greencore Group shareholders have received a total shareholder return of 63% over the last year. Notably the five-year annualised TSR loss of 7% per year compares very unfavourably with the recent share price performance. The long term loss makes us cautious, but the short term TSR gain certainly hints at a brighter future. If you would like to research Greencore Group in more detail then you might want to take a look at whether insiders have been buying or selling shares in the company.
But note: Greencore Group may not be the best stock to buy. So take a peek at this free list of interesting companies with past earnings growth (and further growth forecast).
Please note, the market returns quoted in this article reflect the market weighted average returns of stocks that currently trade on British exchanges.
Have feedback on this article? Concerned about the content? Get in touch with us directly. Alternatively, email editorial-team (at) simplywallst.com.
This article by Simply Wall St is general in nature. We provide commentary based on historical data and analyst forecasts only using an unbiased methodology and our articles are not intended to be financial advice. It does not constitute a recommendation to buy or sell any stock, and does not take account of your objectives, or your financial situation. We aim to bring you long-term focused analysis driven by fundamental data. Note that our analysis may not factor in the latest price-sensitive company announcements or qualitative material. Simply Wall St has no position in any stocks mentioned.
