
 Yahoo Finance
 Investors Heavily Search JD.com, Inc. (JD): Here is What You Need to Know
JD.com, Inc. (JD) has been one of the most searched-for stocks on Zacks.com lately. So, you might want to look at some of the facts that could shape the stock's performance in the near term.
Shares of this company have returned +4.8% over the past month versus the Zacks S&P 500 composite's +4.6% change. The Zacks Internet - Commerce industry, to which JD.com, Inc. belongs, has gained 18.2% over this period. Now the key question is: Where could the stock be headed in the near term?
While media releases or rumors about a substantial change in a company's business prospects usually make its stock 'trending' and lead to an immediate price change, there are always some fundamental facts that eventually dominate the buy-and-hold decision-making.
Earnings Estimate Revisions
Rather than focusing on anything else, we at Zacks prioritize evaluating the change in a company's earnings projection. This is because we believe the fair value for its stock is determined by the present value of its future stream of earnings.
We essentially look at how sell-side analysts covering the stock are revising their earnings estimates to reflect the impact of the latest business trends. And if earnings estimates go up for a company, the fair value for its stock goes up. A higher fair value than the current market price drives investors' interest in buying the stock, leading to its price moving higher. This is why empirical research shows a strong correlation between trends in earnings estimate revisions and near-term stock price movements.
For the current quarter, JD.com, Inc. is expected to post earnings of $0.52 per share, indicating a change of +48.6% from the year-ago quarter. The Zacks Consensus Estimate has changed +4.8% over the last 30 days.
The consensus earnings estimate of $2.44 for the current fiscal year indicates a year-over-year change of +44.4%. This estimate has changed +3.3% over the last 30 days.
For the next fiscal year, the consensus earnings estimate of $2.78 indicates a change of +13.7% from what JD.com, Inc. is expected to report a year ago. Over the past month, the estimate has changed +2.2%.
With an impressive externally audited track record, our proprietary stock rating tool -- the Zacks Rank -- is a more conclusive indicator of a stock's near-term price performance, as it effectively harnesses the power of earnings estimate revisions. The size of the recent change in the consensus estimate, along with three other factors related to earnings estimates, has resulted in a Zacks Rank #1 (Strong Buy) for JD.com, Inc.
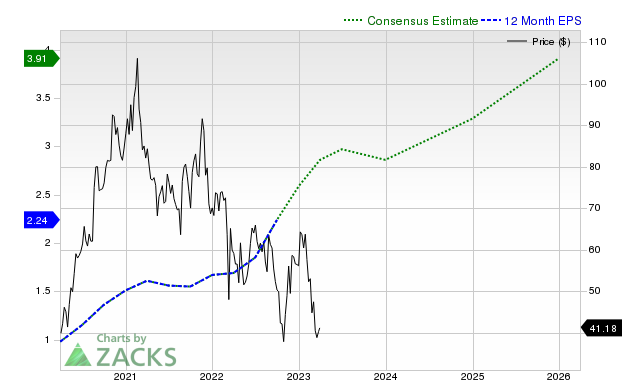
The chart below shows the evolution of the company's forward 12-month consensus EPS estimate:
12 Month EPS
Revenue Growth Forecast
Even though a company's earnings growth is arguably the best indicator of its financial health, nothing much happens if it cannot raise its revenues. It's almost impossible for a company to grow its earnings without growing its revenue for long periods. Therefore, knowing a company's potential revenue growth is crucial.
For JD.com, Inc. the consensus sales estimate for the current quarter of $43.18 billion indicates a year-over-year change of -0.3%. For the current and next fiscal years, $150.49 billion and $170.11 billion estimates indicate +2% and +13% changes, respectively.
Last Reported Results and Surprise History
JD.com, Inc. reported revenues of $34.24 billion in the last reported quarter, representing a year-over-year change of +0.9%. EPS of $0.88 for the same period compares with $0.49 a year ago.
Compared to the Zacks Consensus Estimate of $34.59 billion, the reported revenues represent a surprise of -1.03%. The EPS surprise was +37.5%.
The company beat consensus EPS estimates in each of the trailing four quarters. The company topped consensus revenue estimates three times over this period.
Valuation
Without considering a stock's valuation, no investment decision can be efficient. In predicting a stock's future price performance, it's crucial to determine whether its current price correctly reflects the intrinsic value of the underlying business and the company's growth prospects.
While comparing the current values of a company's valuation multiples, such as price-to-earnings (P/E), price-to-sales (P/S) and price-to-cash flow (P/CF), with its own historical values helps determine whether its stock is fairly valued, overvalued, or undervalued, comparing the company relative to its peers on these parameters gives a good sense of the reasonability of the stock's price.
As part of the Zacks Style Scores system, the Zacks Value Style Score (which evaluates both traditional and unconventional valuation metrics) organizes stocks into five groups ranging from A to F (A is better than B; B is better than C; and so on), making it helpful in identifying whether a stock is overvalued, rightly valued, or temporarily undervalued.
JD.com, Inc. is graded B on this front, indicating that it is trading at a discount to its peers. Click here to see the values of some of the valuation metrics that have driven this grade.
Conclusion
The facts discussed here and much other information on Zacks.com might help determine whether or not it's worthwhile paying attention to the market buzz about JD.com, Inc. However, its Zacks Rank #1 does suggest that it may outperform the broader market in the near term.
Want the latest recommendations from Zacks Investment Research? Today, you can download 7 Best Stocks for the Next 30 Days. Click to get this free report
JD.com, Inc. (JD) : Free Stock Analysis Report
