
 Yahoo Finance
 Investors in Hooker Furnishings (NASDAQ:HOFT) have unfortunately lost 9.1% over the last year
It's easy to match the overall market return by buying an index fund. While individual stocks can be big winners, plenty more fail to generate satisfactory returns. Investors in Hooker Furnishings Corporation (NASDAQ:HOFT) have tasted that bitter downside in the last year, as the share price dropped 11%. That contrasts poorly with the market return of 35%. Looking at the longer term, the stock is down 9.4% over three years. It's down 21% in about a quarter.
With that in mind, it's worth seeing if the company's underlying fundamentals have been the driver of long term performance, or if there are some discrepancies.
See our latest analysis for Hooker Furnishings
While the efficient markets hypothesis continues to be taught by some, it has been proven that markets are over-reactive dynamic systems, and investors are not always rational. By comparing earnings per share (EPS) and share price changes over time, we can get a feel for how investor attitudes to a company have morphed over time.
During the last year Hooker Furnishings grew its earnings per share, moving from a loss to a profit.
Earnings per share growth rates aren't particularly useful for comparing with the share price, when a company has moved from loss to profit. So it makes sense to check out some other factors.
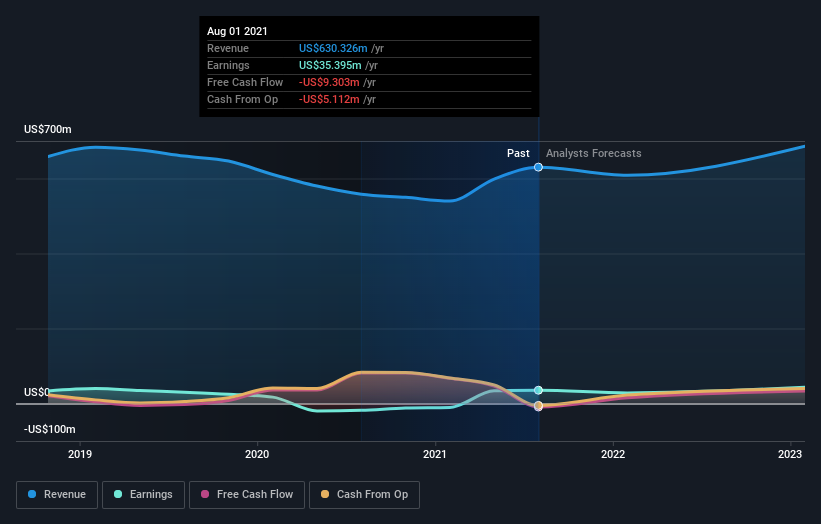
Hooker Furnishings' revenue is actually up 13% over the last year. Since the fundamental metrics don't readily explain the share price drop, there might be an opportunity if the market has overreacted.
The company's revenue and earnings (over time) are depicted in the image below (click to see the exact numbers).
We like that insiders have been buying shares in the last twelve months. Even so, future earnings will be far more important to whether current shareholders make money. So it makes a lot of sense to check out what analysts think Hooker Furnishings will earn in the future (free profit forecasts).
A Different Perspective
Hooker Furnishings shareholders are down 9.1% for the year (even including dividends), but the market itself is up 35%. Even the share prices of good stocks drop sometimes, but we want to see improvements in the fundamental metrics of a business, before getting too interested. On the bright side, long term shareholders have made money, with a gain of 2% per year over half a decade. It could be that the recent sell-off is an opportunity, so it may be worth checking the fundamental data for signs of a long term growth trend. I find it very interesting to look at share price over the long term as a proxy for business performance. But to truly gain insight, we need to consider other information, too. For instance, we've identified 2 warning signs for Hooker Furnishings (1 makes us a bit uncomfortable) that you should be aware of.
There are plenty of other companies that have insiders buying up shares. You probably do not want to miss this free list of growing companies that insiders are buying.
Please note, the market returns quoted in this article reflect the market weighted average returns of stocks that currently trade on US exchanges.
This article by Simply Wall St is general in nature. We provide commentary based on historical data and analyst forecasts only using an unbiased methodology and our articles are not intended to be financial advice. It does not constitute a recommendation to buy or sell any stock, and does not take account of your objectives, or your financial situation. We aim to bring you long-term focused analysis driven by fundamental data. Note that our analysis may not factor in the latest price-sensitive company announcements or qualitative material. Simply Wall St has no position in any stocks mentioned.
Have feedback on this article? Concerned about the content? Get in touch with us directly. Alternatively, email editorial-team (at) simplywallst.com.
