
 Yahoo Finance
 Investors in Keller Group (LON:KLR) have made a splendid return of 128% over the past three years
By buying an index fund, you can roughly match the market return with ease. But if you choose individual stocks with prowess, you can make superior returns. For example, Keller Group plc (LON:KLR) shareholders have seen the share price rise 96% over three years, well in excess of the market return (16%, not including dividends). However, more recent returns haven't been as impressive as that, with the stock returning just 47% in the last year , including dividends .
Let's take a look at the underlying fundamentals over the longer term, and see if they've been consistent with shareholders returns.
View our latest analysis for Keller Group
To quote Buffett, 'Ships will sail around the world but the Flat Earth Society will flourish. There will continue to be wide discrepancies between price and value in the marketplace...' One imperfect but simple way to consider how the market perception of a company has shifted is to compare the change in the earnings per share (EPS) with the share price movement.
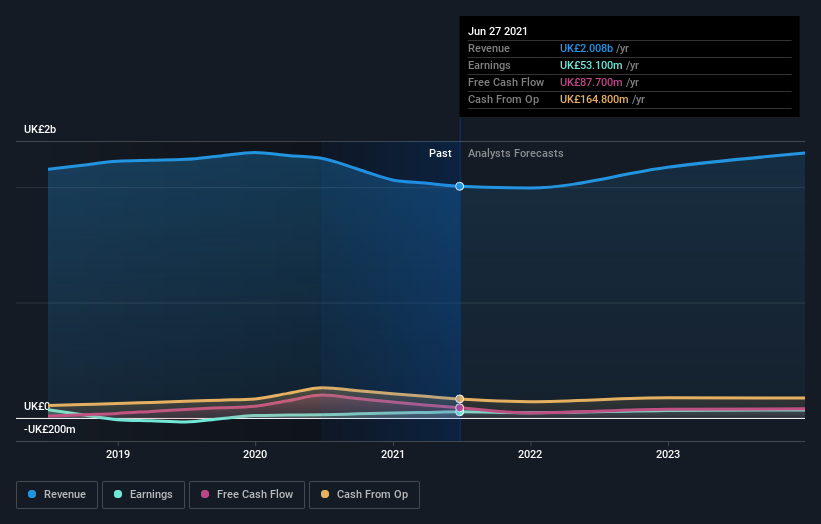
Over the last three years, Keller Group failed to grow earnings per share, which fell 9.1% (annualized).
This means it's unlikely the market is judging the company based on earnings growth. Since the change in EPS doesn't seem to correlate with the change in share price, it's worth taking a look at other metrics.
You can only imagine how long term shareholders feel about the declining revenue trend (slipping at 2.5% per year). The only thing that's clear is there is low correlation between Keller Group's share price and its historic fundamental data. Further research may be required!
The company's revenue and earnings (over time) are depicted in the image below (click to see the exact numbers).
We know that Keller Group has improved its bottom line lately, but what does the future have in store? If you are thinking of buying or selling Keller Group stock, you should check out this free report showing analyst profit forecasts.
What About Dividends?
As well as measuring the share price return, investors should also consider the total shareholder return (TSR). The TSR incorporates the value of any spin-offs or discounted capital raisings, along with any dividends, based on the assumption that the dividends are reinvested. Arguably, the TSR gives a more comprehensive picture of the return generated by a stock. In the case of Keller Group, it has a TSR of 128% for the last 3 years. That exceeds its share price return that we previously mentioned. The dividends paid by the company have thusly boosted the total shareholder return.
A Different Perspective
It's nice to see that Keller Group shareholders have received a total shareholder return of 47% over the last year. And that does include the dividend. Since the one-year TSR is better than the five-year TSR (the latter coming in at 8% per year), it would seem that the stock's performance has improved in recent times. Given the share price momentum remains strong, it might be worth taking a closer look at the stock, lest you miss an opportunity. Keeping this in mind, a solid next step might be to take a look at Keller Group's dividend track record. This free interactive graph is a great place to start.
Of course Keller Group may not be the best stock to buy. So you may wish to see this free collection of growth stocks.
Please note, the market returns quoted in this article reflect the market weighted average returns of stocks that currently trade on GB exchanges.
Have feedback on this article? Concerned about the content? Get in touch with us directly. Alternatively, email editorial-team (at) simplywallst.com.
This article by Simply Wall St is general in nature. We provide commentary based on historical data and analyst forecasts only using an unbiased methodology and our articles are not intended to be financial advice. It does not constitute a recommendation to buy or sell any stock, and does not take account of your objectives, or your financial situation. We aim to bring you long-term focused analysis driven by fundamental data. Note that our analysis may not factor in the latest price-sensitive company announcements or qualitative material. Simply Wall St has no position in any stocks mentioned.
