
 Yahoo Finance
 Investors in Keller Group (LON:KLR) have seen splendid returns of 109% over the past five years
Generally speaking the aim of active stock picking is to find companies that provide returns that are superior to the market average. And while active stock picking involves risks (and requires diversification) it can also provide excess returns. For example, long term Keller Group plc (LON:KLR) shareholders have enjoyed a 62% share price rise over the last half decade, well in excess of the market return of around 2.4% (not including dividends).
Now it's worth having a look at the company's fundamentals too, because that will help us determine if the long term shareholder return has matched the performance of the underlying business.
See our latest analysis for Keller Group
There is no denying that markets are sometimes efficient, but prices do not always reflect underlying business performance. One imperfect but simple way to consider how the market perception of a company has shifted is to compare the change in the earnings per share (EPS) with the share price movement.
During the last half decade, Keller Group became profitable. That's generally thought to be a genuine positive, so investors may expect to see an increasing share price. Given that the company made a profit three years ago, but not five years ago, it is worth looking at the share price returns over the last three years, too. We can see that the Keller Group share price is up 27% in the last three years. During the same period, EPS grew by 28% each year. This EPS growth is higher than the 8% average annual increase in the share price over the same three years. So you might conclude the market is a little more cautious about the stock, these days. This cautious sentiment is reflected in its (fairly low) P/E ratio of 8.42.
The company's earnings per share (over time) is depicted in the image below (click to see the exact numbers).
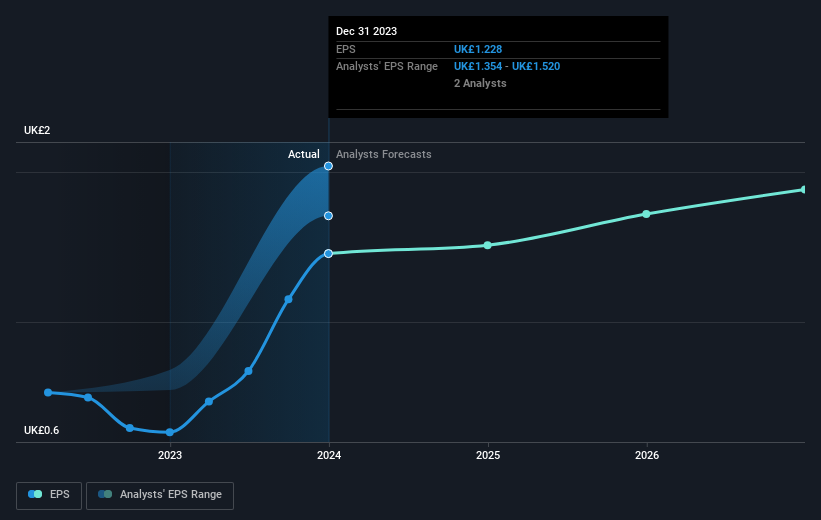
We know that Keller Group has improved its bottom line lately, but is it going to grow revenue? You could check out this free report showing analyst revenue forecasts.
What About Dividends?
It is important to consider the total shareholder return, as well as the share price return, for any given stock. The TSR incorporates the value of any spin-offs or discounted capital raisings, along with any dividends, based on the assumption that the dividends are reinvested. Arguably, the TSR gives a more comprehensive picture of the return generated by a stock. As it happens, Keller Group's TSR for the last 5 years was 109%, which exceeds the share price return mentioned earlier. This is largely a result of its dividend payments!
A Different Perspective
We're pleased to report that Keller Group shareholders have received a total shareholder return of 64% over one year. And that does include the dividend. Since the one-year TSR is better than the five-year TSR (the latter coming in at 16% per year), it would seem that the stock's performance has improved in recent times. Given the share price momentum remains strong, it might be worth taking a closer look at the stock, lest you miss an opportunity. Before forming an opinion on Keller Group you might want to consider the cold hard cash it pays as a dividend. This free chart tracks its dividend over time.
If you would prefer to check out another company -- one with potentially superior financials -- then do not miss this free list of companies that have proven they can grow earnings.
Please note, the market returns quoted in this article reflect the market weighted average returns of stocks that currently trade on British exchanges.
Have feedback on this article? Concerned about the content? Get in touch with us directly. Alternatively, email editorial-team (at) simplywallst.com.
This article by Simply Wall St is general in nature. We provide commentary based on historical data and analyst forecasts only using an unbiased methodology and our articles are not intended to be financial advice. It does not constitute a recommendation to buy or sell any stock, and does not take account of your objectives, or your financial situation. We aim to bring you long-term focused analysis driven by fundamental data. Note that our analysis may not factor in the latest price-sensitive company announcements or qualitative material. Simply Wall St has no position in any stocks mentioned.
