
 Yahoo Finance
 What Investors Should Know About Calix Inc’s (NYSE:CALX) Financial Strength

While small-cap stocks, such as Calix Inc (NYSE:CALX) with its market cap of US$410.58m, are popular for their explosive growth, investors should also be aware of their balance sheet to judge whether the company can survive a downturn. Companies operating in the Communications industry, especially ones that are currently loss-making, tend to be high risk. So, understanding the company’s financial health becomes vital. I believe these basic checks tell most of the story you need to know. However, this commentary is still very high-level, so I’d encourage you to dig deeper yourself into CALX here.
How does CALX’s operating cash flow stack up against its debt?
In the previous 12 months, CALX’s rose by about US$30.00m made up of predominantly near term debt. With this ramp up in debt, CALX currently has US$39.78m remaining in cash and short-term investments , ready to deploy into the business. Moving onto cash from operations, its trivial cash flows from operations make the cash-to-debt ratio less useful to us, though these low levels of cash means that operational efficiency is worth a look. For this article’s sake, I won’t be looking at this today, but you can take a look at some of CALX’s operating efficiency ratios such as ROA here.
Can CALX meet its short-term obligations with the cash in hand?
Looking at CALX’s most recent US$128.33m liabilities, it appears that the company has been able to meet these obligations given the level of current assets of US$162.46m, with a current ratio of 1.27x. For Communications companies, this ratio is within a sensible range as there’s enough of a cash buffer without holding too capital in low return investments.
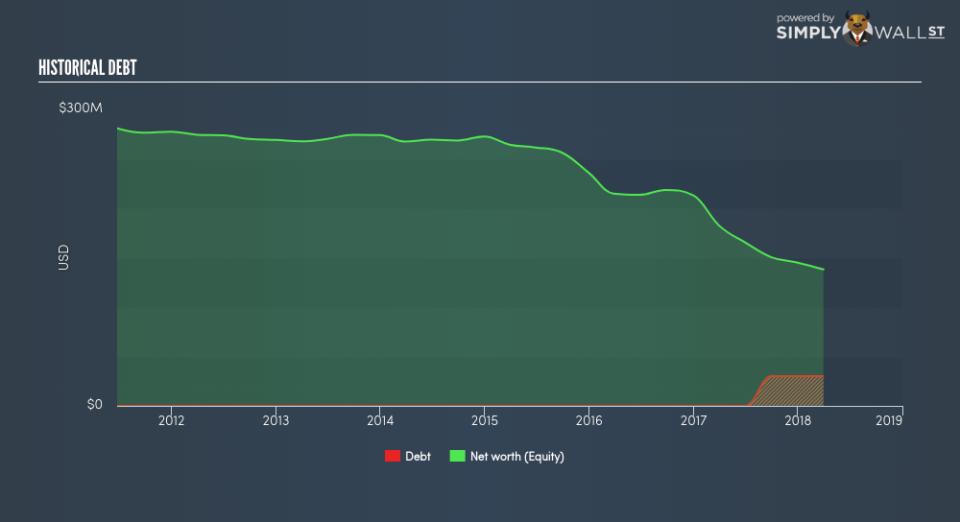
Does CALX face the risk of succumbing to its debt-load?
With debt at 21.73% of equity, CALX may be thought of as appropriately levered. This range is considered safe as CALX is not taking on too much debt obligation, which may be constraining for future growth. Risk around debt is very low for CALX, and the company also has the ability and headroom to increase debt if needed going forward.
Next Steps:
CALX’s low debt is also met with low coverage. This indicates room for improvement as its cash flow covers less than a quarter of its borrowings, which means its operating efficiency could be better. However, the company will be able to pay all of its upcoming liabilities from its current short-term assets. I admit this is a fairly basic analysis for CALX’s financial health. Other important fundamentals need to be considered alongside. I recommend you continue to research Calix to get a more holistic view of the stock by looking at:
Future Outlook: What are well-informed industry analysts predicting for CALX’s future growth? Take a look at our free research report of analyst consensus for CALX’s outlook.
Historical Performance: What has CALX’s returns been like over the past? Go into more detail in the past track record analysis and take a look at the free visual representations of our analysis for more clarity.
Other High-Performing Stocks: Are there other stocks that provide better prospects with proven track records? Explore our free list of these great stocks here.
To help readers see pass the short term volatility of the financial market, we aim to bring you a long-term focused research analysis purely driven by fundamental data. Note that our analysis does not factor in the latest price sensitive company announcements.
The author is an independent contributor and at the time of publication had no position in the stocks mentioned.
