
 Yahoo Finance
 What Investors Should Know About CONSOL Energy Inc.'s (NYSE:CEIX) Financial Strength

Want to participate in a short research study? Help shape the future of investing tools and you could win a $250 gift card!
While small-cap stocks, such as CONSOL Energy Inc. (NYSE:CEIX) with its market cap of US$699m, are popular for their explosive growth, investors should also be aware of their balance sheet to judge whether the company can survive a downturn. Evaluating financial health as part of your investment thesis is essential, as mismanagement of capital can lead to bankruptcies, which occur at a higher rate for small-caps. We'll look at some basic checks that can form a snapshot the company’s financial strength. Nevertheless, this is not a comprehensive overview, so I suggest you dig deeper yourself into CEIX here.
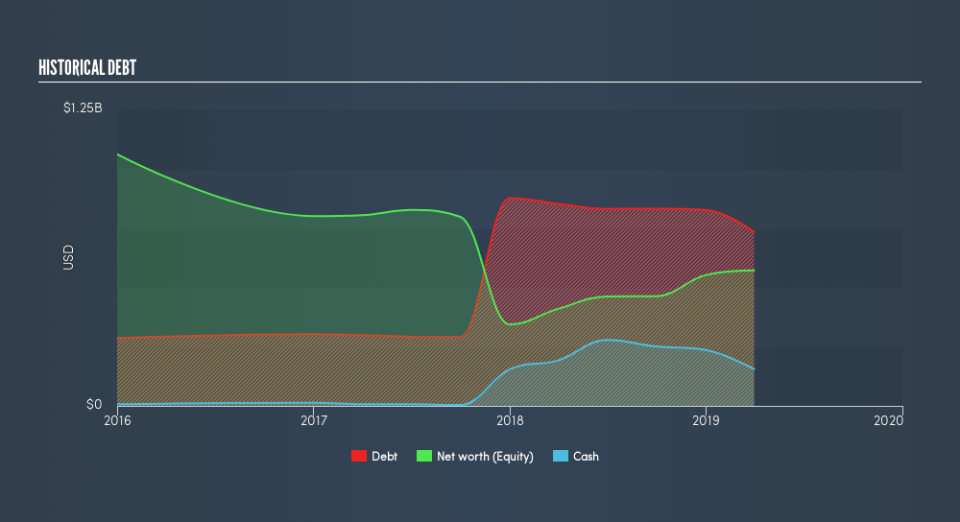
CEIX’s Debt (And Cash Flows)
CEIX's debt level has been constant at around US$862m over the previous year including long-term debt. At this stable level of debt, CEIX's cash and short-term investments stands at US$155m to keep the business going. Additionally, CEIX has produced US$380m in operating cash flow over the same time period, leading to an operating cash to total debt ratio of 44%, signalling that CEIX’s debt is appropriately covered by operating cash.
Can CEIX meet its short-term obligations with the cash in hand?
At the current liabilities level of US$417m, the company arguably has a rather low level of current assets relative its obligations, with the current ratio last standing at 0.97x. The current ratio is the number you get when you divide current assets by current liabilities.
Does CEIX face the risk of succumbing to its debt-load?
CEIX is a highly-leveraged company with debt exceeding equity by over 100%. This is a bit unusual for a small-cap stock, since they generally have a harder time borrowing than large more established companies. We can check to see whether CEIX is able to meet its debt obligations by looking at the net interest coverage ratio. A company generating earnings before interest and tax (EBIT) at least three times its net interest payments is considered financially sound. In CEIX's, case, the ratio of 3.01x suggests that interest is appropriately covered, which means that debtors may be willing to loan the company more money, giving CEIX ample headroom to grow its debt facilities.
Next Steps:
Although CEIX’s debt level is towards the higher end of the spectrum, its cash flow coverage seems adequate to meet debt obligations which means its debt is being efficiently utilised. Though its lack of liquidity raises questions over current asset management practices for the small-cap. This is only a rough assessment of financial health, and I'm sure CEIX has company-specific issues impacting its capital structure decisions. You should continue to research CONSOL Energy to get a better picture of the stock by looking at:
Future Outlook: What are well-informed industry analysts predicting for CEIX’s future growth? Take a look at our free research report of analyst consensus for CEIX’s outlook.
Valuation: What is CEIX worth today? Is the stock undervalued, even when its growth outlook is factored into its intrinsic value? The intrinsic value infographic in our free research report helps visualize whether CEIX is currently mispriced by the market.
Other High-Performing Stocks: Are there other stocks that provide better prospects with proven track records? Explore our free list of these great stocks here.
We aim to bring you long-term focused research analysis driven by fundamental data. Note that our analysis may not factor in the latest price-sensitive company announcements or qualitative material.
If you spot an error that warrants correction, please contact the editor at editorial-team@simplywallst.com. This article by Simply Wall St is general in nature. It does not constitute a recommendation to buy or sell any stock, and does not take account of your objectives, or your financial situation. Simply Wall St has no position in the stocks mentioned. Thank you for reading.
