
 Yahoo Finance
 What Investors Should Know About GVC Holdings PLC's (LON:GVC) Financial Strength

While small-cap stocks, such as GVC Holdings PLC (LON:GVC) with its market cap of UK£3.5b, are popular for their explosive growth, investors should also be aware of their balance sheet to judge whether the company can survive a downturn. Given that GVC is not presently profitable, it’s essential to assess the current state of its operations and pathway to profitability. We'll look at some basic checks that can form a snapshot the company’s financial strength. However, potential investors would need to take a closer look, and I recommend you dig deeper yourself into GVC here.
Does GVC Produce Much Cash Relative To Its Debt?
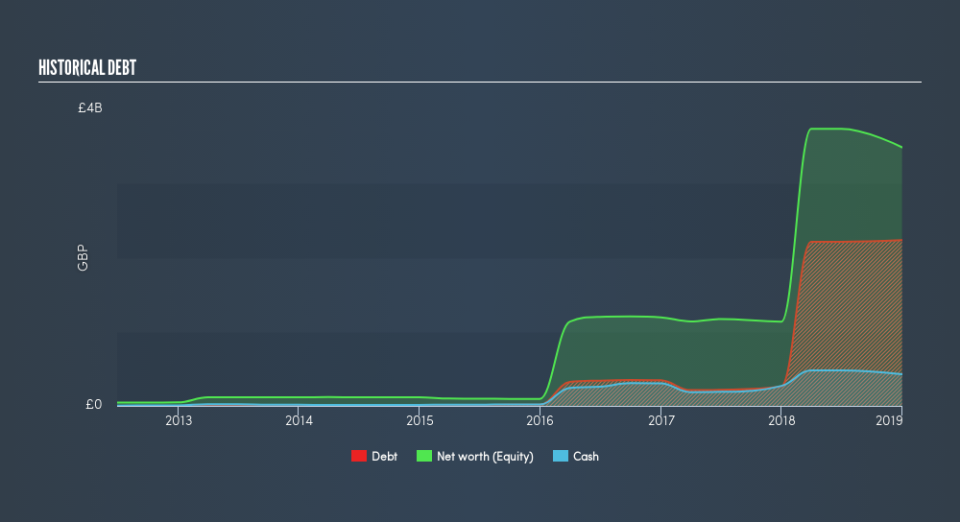
GVC's debt levels surged from UK£262m to UK£2.2b over the last 12 months , which includes long-term debt. With this rise in debt, the current cash and short-term investment levels stands at UK£428m , ready to be used for running the business. Additionally, GVC has generated cash from operations of UK£297m over the same time period, resulting in an operating cash to total debt ratio of 13%, indicating that GVC’s debt is not covered by operating cash.
Can GVC meet its short-term obligations with the cash in hand?
With current liabilities at UK£1.2b, it seems that the business may not be able to easily meet these obligations given the level of current assets of UK£905m, with a current ratio of 0.76x. The current ratio is calculated by dividing current assets by current liabilities.
Does GVC face the risk of succumbing to its debt-load?
With a debt-to-equity ratio of 64%, GVC can be considered as an above-average leveraged company. This is a bit unusual for a small-cap stock, since they generally have a harder time borrowing than large more established companies. However, since GVC is presently unprofitable, there’s a question of sustainability of its current operations. Maintaining a high level of debt, while revenues are still below costs, can be dangerous as liquidity tends to dry up in unexpected downturns.
Next Steps:
GVC’s high cash coverage means that, although its debt levels are high, the company is able to utilise its borrowings efficiently in order to generate cash flow. But, its low liquidity raises concerns over whether current asset management practices are properly implemented for the small-cap. Keep in mind I haven't considered other factors such as how GVC has been performing in the past. I suggest you continue to research GVC Holdings to get a better picture of the stock by looking at:
Future Outlook: What are well-informed industry analysts predicting for GVC’s future growth? Take a look at our free research report of analyst consensus for GVC’s outlook.
Valuation: What is GVC worth today? Is the stock undervalued, even when its growth outlook is factored into its intrinsic value? The intrinsic value infographic in our free research report helps visualize whether GVC is currently mispriced by the market.
Other High-Performing Stocks: Are there other stocks that provide better prospects with proven track records? Explore our free list of these great stocks here.
We aim to bring you long-term focused research analysis driven by fundamental data. Note that our analysis may not factor in the latest price-sensitive company announcements or qualitative material.
If you spot an error that warrants correction, please contact the editor at editorial-team@simplywallst.com. This article by Simply Wall St is general in nature. It does not constitute a recommendation to buy or sell any stock, and does not take account of your objectives, or your financial situation. Simply Wall St has no position in the stocks mentioned. Thank you for reading.
