
 Yahoo Finance
 What Investors Should Know About Lands’ End Inc’s (NASDAQ:LE) Financial Strength

Lands’ End Inc (NASDAQ:LE) is a small-cap stock with a market capitalization of US$708.51M. While investors primarily focus on the growth potential and competitive landscape of the small-cap companies, they end up ignoring a key aspect, which could be the biggest threat to its existence: its financial health. Why is it important? Online Retail businesses operating in the environment facing headwinds from current disruption, even ones that are profitable, tend to be high risk. So, understanding the company’s financial health becomes vital. I believe these basic checks tell most of the story you need to know. Nevertheless, since I only look at basic financial figures, I suggest you dig deeper yourself into LE here.
Does LE generate an acceptable amount of cash through operations?
Over the past year, LE has maintained its debt levels at around US$491.40M – this includes both the current and long-term debt. At this constant level of debt, the current cash and short-term investment levels stands at US$195.58M for investing into the business. Moreover, LE has generated US$28.44M in operating cash flow in the last twelve months, resulting in an operating cash to total debt ratio of 5.79%, signalling that LE’s current level of operating cash is not high enough to cover debt. This ratio can also be interpreted as a measure of efficiency as an alternative to return on assets. In LE’s case, it is able to generate 0.058x cash from its debt capital.
Does LE’s liquid assets cover its short-term commitments?
Looking at LE’s most recent US$256.13M liabilities, it appears that the company has been able to meet these commitments with a current assets level of US$606.75M, leading to a 2.37x current account ratio. Generally, for Online Retail companies, this is a reasonable ratio since there is a bit of a cash buffer without leaving too much capital in a low-return environment.
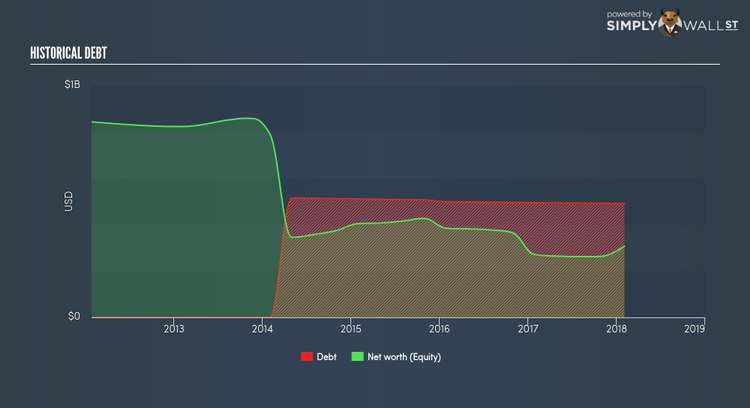
Can LE service its debt comfortably?
LE is a highly-leveraged company with debt exceeding equity by over 100%. This is not uncommon for a small-cap company given that debt tends to be lower-cost and at times, more accessible. We can check to see whether LE is able to meet its debt obligations by looking at the net interest coverage ratio. A company generating earnings before interest and tax (EBIT) at least three times its net interest payments is considered financially sound. In LE’s, case, the ratio of 1.27x suggests that interest is not strongly covered, which means that debtors may be less inclined to loan the company more money, reducing its headroom for growth through debt.
Next Steps:
At its current level of cash flow coverage, LE has room for improvement to better cushion for events which may require debt repayment. Though, the company will be able to pay all of its upcoming liabilities from its current short-term assets. This is only a rough assessment of financial health, and I’m sure LE has company-specific issues impacting its capital structure decisions. You should continue to research Lands’ End to get a better picture of the stock by looking at:
Future Outlook: What are well-informed industry analysts predicting for LE’s future growth? Take a look at our free research report of analyst consensus for LE’s outlook.
Historical Performance: What has LE’s returns been like over the past? Go into more detail in the past track record analysis and take a look at the free visual representations of our analysis for more clarity.
Other High-Performing Stocks: Are there other stocks that provide better prospects with proven track records? Explore our free list of these great stocks here.
To help readers see pass the short term volatility of the financial market, we aim to bring you a long-term focused research analysis purely driven by fundamental data. Note that our analysis does not factor in the latest price sensitive company announcements.
The author is an independent contributor and at the time of publication had no position in the stocks mentioned.
