
 Yahoo Finance
 What Investors Should Know About Northbridge Industrial Services plc’s (LON:NBI) Financial Strength

Northbridge Industrial Services plc (LON:NBI) is a small-cap stock with a market capitalization of UK£33.54m. While investors primarily focus on the growth potential and competitive landscape of the small-cap companies, they end up ignoring a key aspect, which could be the biggest threat to its existence: its financial health. Why is it important? Since NBI is loss-making right now, it’s crucial to evaluate the current state of its operations and pathway to profitability. I believe these basic checks tell most of the story you need to know. Nevertheless, I know these factors are very high-level, so I recommend you dig deeper yourself into NBI here.
Does NBI produce enough cash relative to debt?
NBI’s debt levels have fallen from UK£13.17m to UK£10.63m over the last 12 months – this includes both the current and long-term debt. With this debt payback, NBI currently has UK£1.90m remaining in cash and short-term investments , ready to deploy into the business. On top of this, NBI has produced cash from operations of UK£1.52m during the same period of time, resulting in an operating cash to total debt ratio of 14.30%, meaning that NBI’s current level of operating cash is not high enough to cover debt. This ratio can also be a sign of operational efficiency for loss making businesses as traditional metrics such as return on asset (ROA) requires a positive net income. In NBI’s case, it is able to generate 0.14x cash from its debt capital.
Can NBI pay its short-term liabilities?
With current liabilities at UK£11.07m, it seems that the business has been able to meet these obligations given the level of current assets of UK£14.65m, with a current ratio of 1.32x. For Electrical companies, this ratio is within a sensible range since there is a bit of a cash buffer without leaving too much capital in a low-return environment.
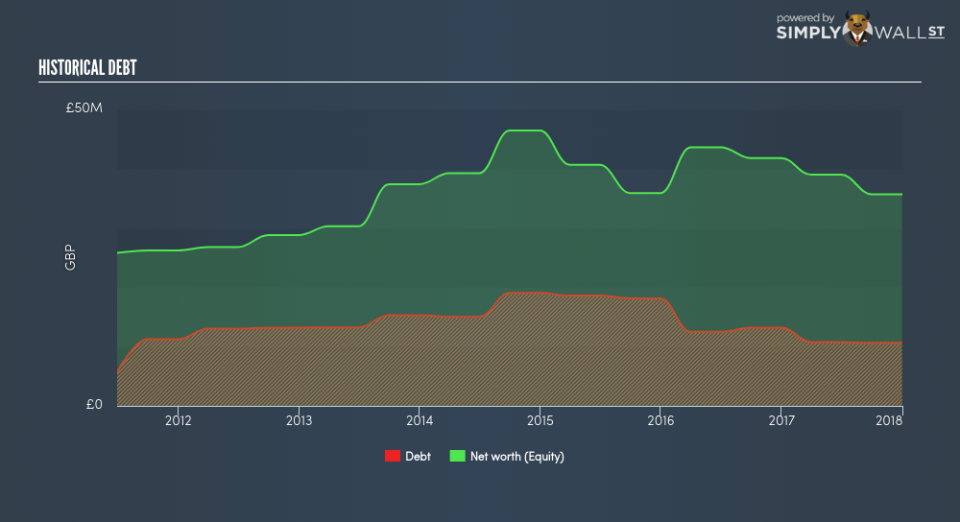
Does NBI face the risk of succumbing to its debt-load?
With debt at 29.79% of equity, NBI may be thought of as appropriately levered. This range is considered safe as NBI is not taking on too much debt obligation, which may be constraining for future growth. NBI’s risk around capital structure is low, and the company has the headroom and ability to raise debt should it need to in the future.
Next Steps:
NBI’s low debt is also met with low coverage. This indicates room for improvement as its cash flow covers less than a quarter of its borrowings, which means its operating efficiency could be better. However, the company will be able to pay all of its upcoming liabilities from its current short-term assets. This is only a rough assessment of financial health, and I’m sure NBI has company-specific issues impacting its capital structure decisions. I recommend you continue to research Northbridge Industrial Services to get a better picture of the stock by looking at:
Future Outlook: What are well-informed industry analysts predicting for NBI’s future growth? Take a look at our free research report of analyst consensus for NBI’s outlook.
Valuation: What is NBI worth today? Is the stock undervalued, even when its growth outlook is factored into its intrinsic value? The intrinsic value infographic in our free research report helps visualize whether NBI is currently mispriced by the market.
Other High-Performing Stocks: Are there other stocks that provide better prospects with proven track records? Explore our free list of these great stocks here.
To help readers see pass the short term volatility of the financial market, we aim to bring you a long-term focused research analysis purely driven by fundamental data. Note that our analysis does not factor in the latest price sensitive company announcements.
The author is an independent contributor and at the time of publication had no position in the stocks mentioned.
