
 Yahoo Finance
 What Investors Should Know About TKH Group N.V.'s (AMS:TWEKA) Financial Strength

Small and large cap stocks are widely popular for a variety of reasons, however, mid-cap companies such as TKH Group N.V. (AMS:TWEKA), with a market cap of €1.8b, often get neglected by retail investors. Despite this, the two other categories have lagged behind the risk-adjusted returns of commonly ignored mid-cap stocks. TWEKA’s financial liquidity and debt position will be analysed in this article, to get an idea of whether the company can fund opportunities for strategic growth and maintain strength through economic downturns. Note that this commentary is very high-level and solely focused on financial health, so I suggest you dig deeper yourself into TWEKA here.
Want to participate in a short research study? Help shape the future of investing tools and you could win a $250 gift card!
View our latest analysis for TKH Group
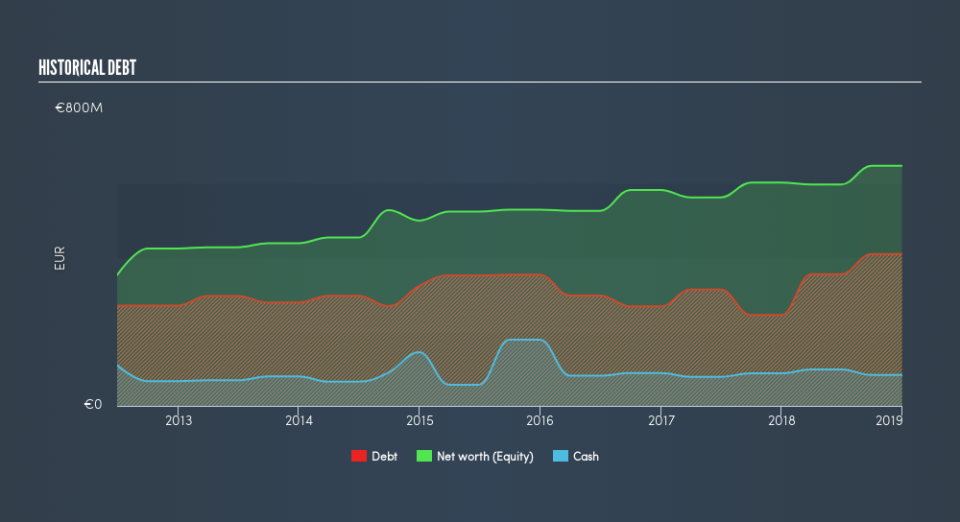
TWEKA’s Debt (And Cash Flows)
Over the past year, TWEKA has ramped up its debt from €245m to €410m , which accounts for long term debt. With this rise in debt, TWEKA's cash and short-term investments stands at €83m to keep the business going. Additionally, TWEKA has generated €127m in operating cash flow during the same period of time, resulting in an operating cash to total debt ratio of 31%, signalling that TWEKA’s current level of operating cash is high enough to cover debt.
Does TWEKA’s liquid assets cover its short-term commitments?
Looking at TWEKA’s €567m in current liabilities, the company has been able to meet these obligations given the level of current assets of €706m, with a current ratio of 1.25x. The current ratio is calculated by dividing current assets by current liabilities. Generally, for Electrical companies, this is a reasonable ratio since there's a sufficient cash cushion without leaving too much capital idle or in low-earning investments.
Can TWEKA service its debt comfortably?
TWEKA is a relatively highly levered company with a debt-to-equity of 63%. This is not unusual for mid-caps as debt tends to be a cheaper and faster source of funding for some businesses. No matter how high the company’s debt, if it can easily cover the interest payments, it’s considered to be efficient with its use of excess leverage. A company generating earnings after interest and tax at least three times its net interest payments is considered financially sound. In TWEKA's case, the ratio of 21.61x suggests that interest is comfortably covered, which means that debtors may be willing to loan the company more money, giving TWEKA ample headroom to grow its debt facilities.
Next Steps:
TWEKA’s high cash coverage means that, although its debt levels are high, the company is able to utilise its borrowings efficiently in order to generate cash flow. This may mean this is an optimal capital structure for the business, given that it is also meeting its short-term commitment. This is only a rough assessment of financial health, and I'm sure TWEKA has company-specific issues impacting its capital structure decisions. I suggest you continue to research TKH Group to get a better picture of the mid-cap by looking at:
Future Outlook: What are well-informed industry analysts predicting for TWEKA’s future growth? Take a look at our free research report of analyst consensus for TWEKA’s outlook.
Valuation: What is TWEKA worth today? Is the stock undervalued, even when its growth outlook is factored into its intrinsic value? The intrinsic value infographic in our free research report helps visualize whether TWEKA is currently mispriced by the market.
Other High-Performing Stocks: Are there other stocks that provide better prospects with proven track records? Explore our free list of these great stocks here.
We aim to bring you long-term focused research analysis driven by fundamental data. Note that our analysis may not factor in the latest price-sensitive company announcements or qualitative material.
If you spot an error that warrants correction, please contact the editor at editorial-team@simplywallst.com. This article by Simply Wall St is general in nature. It does not constitute a recommendation to buy or sell any stock, and does not take account of your objectives, or your financial situation. Simply Wall St has no position in the stocks mentioned. Thank you for reading.
