
 Yahoo Finance
 Investors in De La Rue (LON:DLAR) have unfortunately lost 90% over the last five years
Long term investing is the way to go, but that doesn't mean you should hold every stock forever. It hits us in the gut when we see fellow investors suffer a loss. Anyone who held De La Rue plc (LON:DLAR) for five years would be nursing their metaphorical wounds since the share price dropped 92% in that time. And we doubt long term believers are the only worried holders, since the stock price has declined 61% over the last twelve months. The falls have accelerated recently, with the share price down 35% in the last three months. While a drop like that is definitely a body blow, money isn't as important as health and happiness.
It's worthwhile assessing if the company's economics have been moving in lockstep with these underwhelming shareholder returns, or if there is some disparity between the two. So let's do just that.
View our latest analysis for De La Rue
In his essay The Superinvestors of Graham-and-Doddsville Warren Buffett described how share prices do not always rationally reflect the value of a business. One imperfect but simple way to consider how the market perception of a company has shifted is to compare the change in the earnings per share (EPS) with the share price movement.
Over five years De La Rue's earnings per share dropped significantly, falling to a loss, with the share price also lower. This was, in part, due to extraordinary items impacting earnings. Since the company has fallen to a loss making position, it's hard to compare the change in EPS with the share price change. However, we can say we'd expect to see a falling share price in this scenario.
You can see how EPS has changed over time in the image below (click on the chart to see the exact values).
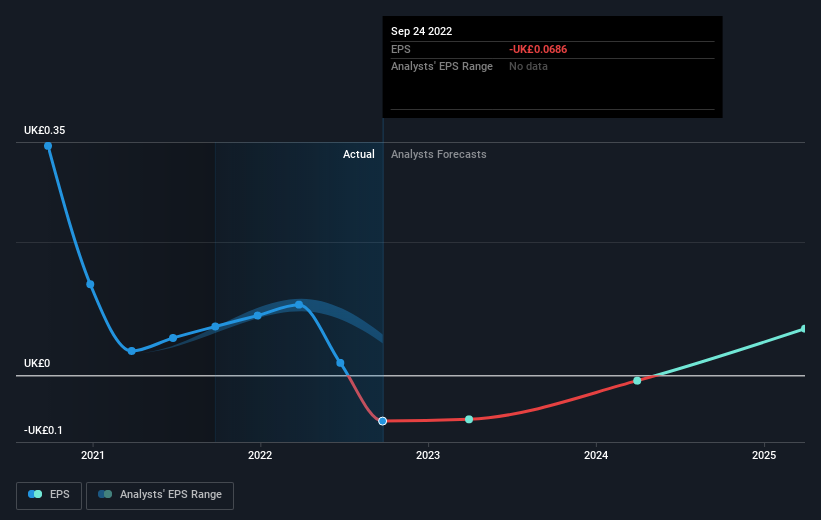
Dive deeper into De La Rue's key metrics by checking this interactive graph of De La Rue's earnings, revenue and cash flow.
A Different Perspective
De La Rue shareholders are down 61% for the year, but the market itself is up 1.5%. However, keep in mind that even the best stocks will sometimes underperform the market over a twelve month period. Regrettably, last year's performance caps off a bad run, with the shareholders facing a total loss of 14% per year over five years. Generally speaking long term share price weakness can be a bad sign, though contrarian investors might want to research the stock in hope of a turnaround. I find it very interesting to look at share price over the long term as a proxy for business performance. But to truly gain insight, we need to consider other information, too. To that end, you should learn about the 2 warning signs we've spotted with De La Rue (including 1 which is a bit concerning) .
Of course De La Rue may not be the best stock to buy. So you may wish to see this free collection of growth stocks.
Please note, the market returns quoted in this article reflect the market weighted average returns of stocks that currently trade on British exchanges.
Have feedback on this article? Concerned about the content? Get in touch with us directly. Alternatively, email editorial-team (at) simplywallst.com.
This article by Simply Wall St is general in nature. We provide commentary based on historical data and analyst forecasts only using an unbiased methodology and our articles are not intended to be financial advice. It does not constitute a recommendation to buy or sell any stock, and does not take account of your objectives, or your financial situation. We aim to bring you long-term focused analysis driven by fundamental data. Note that our analysis may not factor in the latest price-sensitive company announcements or qualitative material. Simply Wall St has no position in any stocks mentioned.
Join A Paid User Research Session
You’ll receive a US$30 Amazon Gift card for 1 hour of your time while helping us build better investing tools for the individual investors like yourself. Sign up here
