
 Yahoo Finance
 Some Investors May Be Worried About Autosports Group's (ASX:ASG) Returns On Capital
What trends should we look for it we want to identify stocks that can multiply in value over the long term? Typically, we'll want to notice a trend of growing return on capital employed (ROCE) and alongside that, an expanding base of capital employed. Ultimately, this demonstrates that it's a business that is reinvesting profits at increasing rates of return. In light of that, when we looked at Autosports Group (ASX:ASG) and its ROCE trend, we weren't exactly thrilled.
What is Return On Capital Employed (ROCE)?
Just to clarify if you're unsure, ROCE is a metric for evaluating how much pre-tax income (in percentage terms) a company earns on the capital invested in its business. To calculate this metric for Autosports Group, this is the formula:
Return on Capital Employed = Earnings Before Interest and Tax (EBIT) ÷ (Total Assets - Current Liabilities)
0.12 = AU$91m ÷ (AU$1.2b - AU$452m) (Based on the trailing twelve months to December 2021).
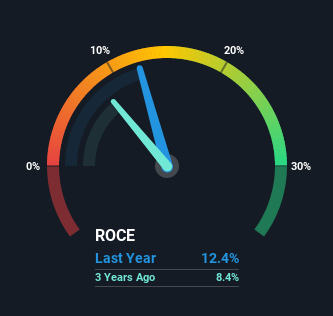
Thus, Autosports Group has an ROCE of 12%. In absolute terms, that's a pretty standard return but compared to the Specialty Retail industry average it falls behind.
View our latest analysis for Autosports Group
Above you can see how the current ROCE for Autosports Group compares to its prior returns on capital, but there's only so much you can tell from the past. If you'd like to see what analysts are forecasting going forward, you should check out our free report for Autosports Group.
What Can We Tell From Autosports Group's ROCE Trend?
In terms of Autosports Group's historical ROCE movements, the trend isn't fantastic. Around five years ago the returns on capital were 16%, but since then they've fallen to 12%. However, given capital employed and revenue have both increased it appears that the business is currently pursuing growth, at the consequence of short term returns. If these investments prove successful, this can bode very well for long term stock performance.
On a side note, Autosports Group has done well to pay down its current liabilities to 38% of total assets. That could partly explain why the ROCE has dropped. What's more, this can reduce some aspects of risk to the business because now the company's suppliers or short-term creditors are funding less of its operations. Some would claim this reduces the business' efficiency at generating ROCE since it is now funding more of the operations with its own money.
The Key Takeaway
While returns have fallen for Autosports Group in recent times, we're encouraged to see that sales are growing and that the business is reinvesting in its operations. However, despite the promising trends, the stock has fallen 10% over the last five years, so there might be an opportunity here for astute investors. So we think it'd be worthwhile to look further into this stock given the trends look encouraging.
One more thing, we've spotted 2 warning signs facing Autosports Group that you might find interesting.
If you want to search for solid companies with great earnings, check out this free list of companies with good balance sheets and impressive returns on equity.
Have feedback on this article? Concerned about the content? Get in touch with us directly. Alternatively, email editorial-team (at) simplywallst.com.
This article by Simply Wall St is general in nature. We provide commentary based on historical data and analyst forecasts only using an unbiased methodology and our articles are not intended to be financial advice. It does not constitute a recommendation to buy or sell any stock, and does not take account of your objectives, or your financial situation. We aim to bring you long-term focused analysis driven by fundamental data. Note that our analysis may not factor in the latest price-sensitive company announcements or qualitative material. Simply Wall St has no position in any stocks mentioned.
