
 Yahoo Finance
 Some Investors May Be Worried About Iridium Communications' (NASDAQ:IRDM) Returns On Capital
Ignoring the stock price of a company, what are the underlying trends that tell us a business is past the growth phase? A business that's potentially in decline often shows two trends, a return on capital employed (ROCE) that's declining, and a base of capital employed that's also declining. Basically the company is earning less on its investments and it is also reducing its total assets. In light of that, from a first glance at Iridium Communications (NASDAQ:IRDM), we've spotted some signs that it could be struggling, so let's investigate.
Return On Capital Employed (ROCE): What is it?
For those that aren't sure what ROCE is, it measures the amount of pre-tax profits a company can generate from the capital employed in its business. Analysts use this formula to calculate it for Iridium Communications:
Return on Capital Employed = Earnings Before Interest and Tax (EBIT) ÷ (Total Assets - Current Liabilities)
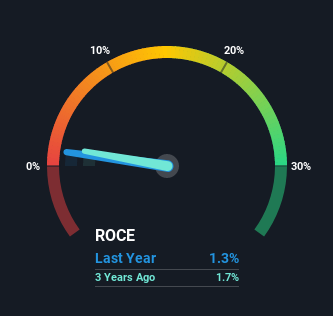
0.013 = US$41m ÷ (US$3.2b - US$93m) (Based on the trailing twelve months to September 2021).
Therefore, Iridium Communications has an ROCE of 1.3%. In absolute terms, that's a low return and it also under-performs the Telecom industry average of 8.8%.
See our latest analysis for Iridium Communications
In the above chart we have measured Iridium Communications' prior ROCE against its prior performance, but the future is arguably more important. If you're interested, you can view the analysts predictions in our free report on analyst forecasts for the company.
The Trend Of ROCE
In terms of Iridium Communications' historical ROCE movements, the trend doesn't inspire confidence. About five years ago, returns on capital were 5.3%, however they're now substantially lower than that as we saw above. And on the capital employed front, the business is utilizing roughly the same amount of capital as it was back then. This combination can be indicative of a mature business that still has areas to deploy capital, but the returns received aren't as high due potentially to new competition or smaller margins. So because these trends aren't typically conducive to creating a multi-bagger, we wouldn't hold our breath on Iridium Communications becoming one if things continue as they have.
Our Take On Iridium Communications' ROCE
All in all, the lower returns from the same amount of capital employed aren't exactly signs of a compounding machine. Yet despite these poor fundamentals, the stock has gained a huge 286% over the last five years, so investors appear very optimistic. In any case, the current underlying trends don't bode well for long term performance so unless they reverse, we'd start looking elsewhere.
One more thing to note, we've identified 1 warning sign with Iridium Communications and understanding it should be part of your investment process.
While Iridium Communications may not currently earn the highest returns, we've compiled a list of companies that currently earn more than 25% return on equity. Check out this free list here.
Have feedback on this article? Concerned about the content? Get in touch with us directly. Alternatively, email editorial-team (at) simplywallst.com.
This article by Simply Wall St is general in nature. We provide commentary based on historical data and analyst forecasts only using an unbiased methodology and our articles are not intended to be financial advice. It does not constitute a recommendation to buy or sell any stock, and does not take account of your objectives, or your financial situation. We aim to bring you long-term focused analysis driven by fundamental data. Note that our analysis may not factor in the latest price-sensitive company announcements or qualitative material. Simply Wall St has no position in any stocks mentioned.
