
 Yahoo Finance
 Some Investors May Be Worried About Northern Bear's (LON:NTBR) Returns On Capital
If you're looking at a mature business that's past the growth phase, what are some of the underlying trends that pop up? Businesses in decline often have two underlying trends, firstly, a declining return on capital employed (ROCE) and a declining base of capital employed. This combination can tell you that not only is the company investing less, it's earning less on what it does invest. And from a first read, things don't look too good at Northern Bear (LON:NTBR), so let's see why.
Understanding Return On Capital Employed (ROCE)
For those who don't know, ROCE is a measure of a company's yearly pre-tax profit (its return), relative to the capital employed in the business. The formula for this calculation on Northern Bear is:
Return on Capital Employed = Earnings Before Interest and Tax (EBIT) ÷ (Total Assets - Current Liabilities)
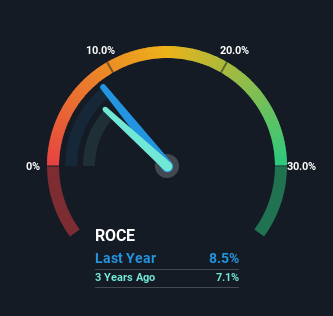
0.085 = UK£2.1m ÷ (UK£40m - UK£15m) (Based on the trailing twelve months to March 2023).
Therefore, Northern Bear has an ROCE of 8.5%. In absolute terms, that's a low return and it also under-performs the Consumer Durables industry average of 12%.
Check out our latest analysis for Northern Bear
Above you can see how the current ROCE for Northern Bear compares to its prior returns on capital, but there's only so much you can tell from the past. If you'd like, you can check out the forecasts from the analysts covering Northern Bear here for free.
What The Trend Of ROCE Can Tell Us
In terms of Northern Bear's historical ROCE movements, the trend doesn't inspire confidence. About five years ago, returns on capital were 12%, however they're now substantially lower than that as we saw above. On top of that, it's worth noting that the amount of capital employed within the business has remained relatively steady. Companies that exhibit these attributes tend to not be shrinking, but they can be mature and facing pressure on their margins from competition. So because these trends aren't typically conducive to creating a multi-bagger, we wouldn't hold our breath on Northern Bear becoming one if things continue as they have.
What We Can Learn From Northern Bear's ROCE
In the end, the trend of lower returns on the same amount of capital isn't typically an indication that we're looking at a growth stock. Investors haven't taken kindly to these developments, since the stock has declined 22% from where it was five years ago. With underlying trends that aren't great in these areas, we'd consider looking elsewhere.
If you'd like to know about the risks facing Northern Bear, we've discovered 2 warning signs that you should be aware of.
While Northern Bear may not currently earn the highest returns, we've compiled a list of companies that currently earn more than 25% return on equity. Check out this free list here.
Have feedback on this article? Concerned about the content? Get in touch with us directly. Alternatively, email editorial-team (at) simplywallst.com.
This article by Simply Wall St is general in nature. We provide commentary based on historical data and analyst forecasts only using an unbiased methodology and our articles are not intended to be financial advice. It does not constitute a recommendation to buy or sell any stock, and does not take account of your objectives, or your financial situation. We aim to bring you long-term focused analysis driven by fundamental data. Note that our analysis may not factor in the latest price-sensitive company announcements or qualitative material. Simply Wall St has no position in any stocks mentioned.
