
 Yahoo Finance
 Some Investors May Be Worried About Public Service Enterprise Group's (NYSE:PEG) Returns On Capital
When researching a stock for investment, what can tell us that the company is in decline? When we see a declining return on capital employed (ROCE) in conjunction with a declining base of capital employed, that's often how a mature business shows signs of aging. This combination can tell you that not only is the company investing less, it's earning less on what it does invest. In light of that, from a first glance at Public Service Enterprise Group (NYSE:PEG), we've spotted some signs that it could be struggling, so let's investigate.
Understanding Return On Capital Employed (ROCE)
Just to clarify if you're unsure, ROCE is a metric for evaluating how much pre-tax income (in percentage terms) a company earns on the capital invested in its business. Analysts use this formula to calculate it for Public Service Enterprise Group:
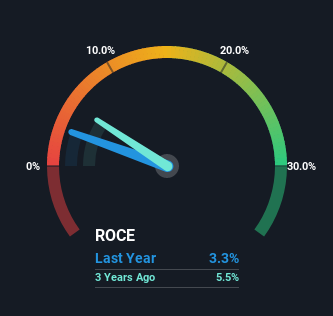
Return on Capital Employed = Earnings Before Interest and Tax (EBIT) ÷ (Total Assets - Current Liabilities)
0.033 = US$1.4b ÷ (US$48b - US$5.3b) (Based on the trailing twelve months to March 2022).
Thus, Public Service Enterprise Group has an ROCE of 3.3%. In absolute terms, that's a low return and it also under-performs the Integrated Utilities industry average of 4.7%.
See our latest analysis for Public Service Enterprise Group
In the above chart we have measured Public Service Enterprise Group's prior ROCE against its prior performance, but the future is arguably more important. If you're interested, you can view the analysts predictions in our free report on analyst forecasts for the company.
How Are Returns Trending?
We are a bit worried about the trend of returns on capital at Public Service Enterprise Group. To be more specific, the ROCE was 6.0% five years ago, but since then it has dropped noticeably. On top of that, it's worth noting that the amount of capital employed within the business has remained relatively steady. Since returns are falling and the business has the same amount of assets employed, this can suggest it's a mature business that hasn't had much growth in the last five years. So because these trends aren't typically conducive to creating a multi-bagger, we wouldn't hold our breath on Public Service Enterprise Group becoming one if things continue as they have.
In Conclusion...
All in all, the lower returns from the same amount of capital employed aren't exactly signs of a compounding machine. However the stock has delivered a 82% return to shareholders over the last five years, so investors might be expecting the trends to turn around. In any case, the current underlying trends don't bode well for long term performance so unless they reverse, we'd start looking elsewhere.
Public Service Enterprise Group does have some risks though, and we've spotted 2 warning signs for Public Service Enterprise Group that you might be interested in.
For those who like to invest in solid companies, check out this free list of companies with solid balance sheets and high returns on equity.
Have feedback on this article? Concerned about the content? Get in touch with us directly. Alternatively, email editorial-team (at) simplywallst.com.
This article by Simply Wall St is general in nature. We provide commentary based on historical data and analyst forecasts only using an unbiased methodology and our articles are not intended to be financial advice. It does not constitute a recommendation to buy or sell any stock, and does not take account of your objectives, or your financial situation. We aim to bring you long-term focused analysis driven by fundamental data. Note that our analysis may not factor in the latest price-sensitive company announcements or qualitative material. Simply Wall St has no position in any stocks mentioned.
