
 Yahoo Finance
 Some Investors May Be Worried About Transcat's (NASDAQ:TRNS) Returns On Capital
To find a multi-bagger stock, what are the underlying trends we should look for in a business? Typically, we'll want to notice a trend of growing return on capital employed (ROCE) and alongside that, an expanding base of capital employed. Basically this means that a company has profitable initiatives that it can continue to reinvest in, which is a trait of a compounding machine. However, after briefly looking over the numbers, we don't think Transcat (NASDAQ:TRNS) has the makings of a multi-bagger going forward, but let's have a look at why that may be.
Understanding Return On Capital Employed (ROCE)
For those that aren't sure what ROCE is, it measures the amount of pre-tax profits a company can generate from the capital employed in its business. To calculate this metric for Transcat, this is the formula:
Return on Capital Employed = Earnings Before Interest and Tax (EBIT) ÷ (Total Assets - Current Liabilities)
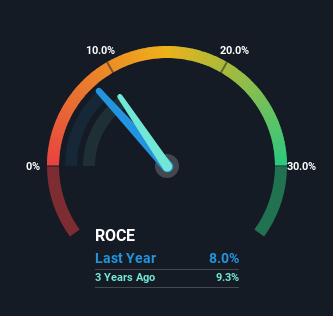
0.08 = US$20m ÷ (US$281m - US$29m) (Based on the trailing twelve months to December 2023).
Therefore, Transcat has an ROCE of 8.0%. Ultimately, that's a low return and it under-performs the Trade Distributors industry average of 13%.
Check out our latest analysis for Transcat
Above you can see how the current ROCE for Transcat compares to its prior returns on capital, but there's only so much you can tell from the past. If you're interested, you can view the analysts predictions in our free analyst report for Transcat .
What Does the ROCE Trend For Transcat Tell Us?
The trend of ROCE doesn't look fantastic because it's fallen from 12% five years ago, while the business's capital employed increased by 205%. However, some of the increase in capital employed could be attributed to the recent capital raising that's been completed prior to their latest reporting period, so keep that in mind when looking at the ROCE decrease. It's unlikely that all of the funds raised have been put to work yet, so as a consequence Transcat might not have received a full period of earnings contribution from it.
What We Can Learn From Transcat's ROCE
In summary, despite lower returns in the short term, we're encouraged to see that Transcat is reinvesting for growth and has higher sales as a result. And long term investors must be optimistic going forward because the stock has returned a huge 355% to shareholders in the last five years. So should these growth trends continue, we'd be optimistic on the stock going forward.
On a separate note, we've found 3 warning signs for Transcat you'll probably want to know about.
While Transcat may not currently earn the highest returns, we've compiled a list of companies that currently earn more than 25% return on equity. Check out this free list here.
Have feedback on this article? Concerned about the content? Get in touch with us directly. Alternatively, email editorial-team (at) simplywallst.com.
This article by Simply Wall St is general in nature. We provide commentary based on historical data and analyst forecasts only using an unbiased methodology and our articles are not intended to be financial advice. It does not constitute a recommendation to buy or sell any stock, and does not take account of your objectives, or your financial situation. We aim to bring you long-term focused analysis driven by fundamental data. Note that our analysis may not factor in the latest price-sensitive company announcements or qualitative material. Simply Wall St has no position in any stocks mentioned.
