
 Yahoo Finance
 Investors in Mind Gym (LON:MIND) have unfortunately lost 72% over the last five years
Mind Gym plc (LON:MIND) shareholders should be happy to see the share price up 11% in the last quarter. But that doesn't change the fact that the returns over the last half decade have been stomach churning. In fact, the share price has tumbled down a mountain to land 73% lower after that period. It's true that the recent bounce could signal the company is turning over a new leaf, but we are not so sure. The fundamental business performance will ultimately determine if the turnaround can be sustained.
With that in mind, it's worth seeing if the company's underlying fundamentals have been the driver of long term performance, or if there are some discrepancies.
View our latest analysis for Mind Gym
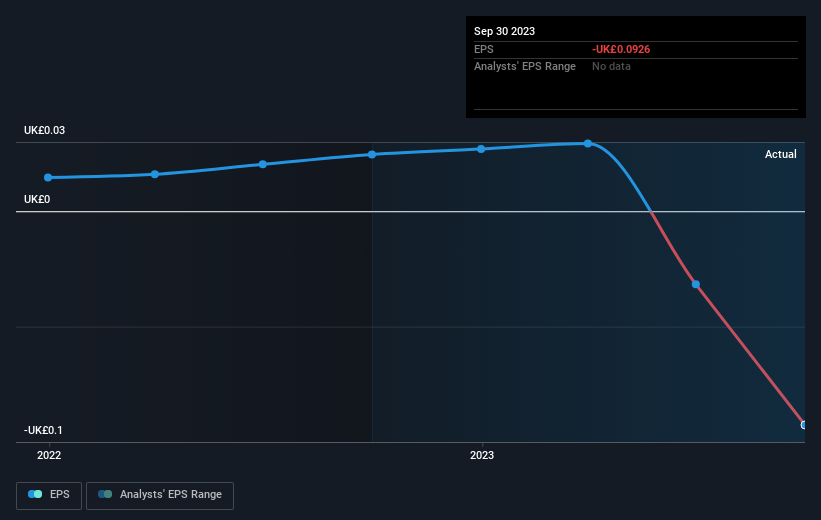
While the efficient markets hypothesis continues to be taught by some, it has been proven that markets are over-reactive dynamic systems, and investors are not always rational. One imperfect but simple way to consider how the market perception of a company has shifted is to compare the change in the earnings per share (EPS) with the share price movement.
Over five years Mind Gym's earnings per share dropped significantly, falling to a loss, with the share price also lower. At present it's hard to make valid comparisons between EPS and the share price. However, we can say we'd expect to see a falling share price in this scenario.
You can see below how EPS has changed over time (discover the exact values by clicking on the image).
It might be well worthwhile taking a look at our free report on Mind Gym's earnings, revenue and cash flow.
A Different Perspective
We regret to report that Mind Gym shareholders are down 45% for the year. Unfortunately, that's worse than the broader market decline of 1.2%. However, it could simply be that the share price has been impacted by broader market jitters. It might be worth keeping an eye on the fundamentals, in case there's a good opportunity. Unfortunately, last year's performance may indicate unresolved challenges, given that it was worse than the annualised loss of 11% over the last half decade. We realise that Baron Rothschild has said investors should "buy when there is blood on the streets", but we caution that investors should first be sure they are buying a high quality business. It's always interesting to track share price performance over the longer term. But to understand Mind Gym better, we need to consider many other factors. For example, we've discovered 2 warning signs for Mind Gym (1 makes us a bit uncomfortable!) that you should be aware of before investing here.
But note: Mind Gym may not be the best stock to buy. So take a peek at this free list of interesting companies with past earnings growth (and further growth forecast).
Please note, the market returns quoted in this article reflect the market weighted average returns of stocks that currently trade on British exchanges.
Have feedback on this article? Concerned about the content? Get in touch with us directly. Alternatively, email editorial-team (at) simplywallst.com.
This article by Simply Wall St is general in nature. We provide commentary based on historical data and analyst forecasts only using an unbiased methodology and our articles are not intended to be financial advice. It does not constitute a recommendation to buy or sell any stock, and does not take account of your objectives, or your financial situation. We aim to bring you long-term focused analysis driven by fundamental data. Note that our analysis may not factor in the latest price-sensitive company announcements or qualitative material. Simply Wall St has no position in any stocks mentioned.
