
 Yahoo Finance
 Investors in Moonpig Group (LON:MOON) have unfortunately lost 48% over the last year
Investors can approximate the average market return by buying an index fund. When you buy individual stocks, you can make higher profits, but you also face the risk of under-performance. Investors in Moonpig Group PLC (LON:MOON) have tasted that bitter downside in the last year, as the share price dropped 48%. That's disappointing when you consider the market returned 6.2%. Moonpig Group may have better days ahead, of course; we've only looked at a one year period. Furthermore, it's down 41% in about a quarter. That's not much fun for holders.
With that in mind, it's worth seeing if the company's underlying fundamentals have been the driver of long term performance, or if there are some discrepancies.
View our latest analysis for Moonpig Group
In his essay The Superinvestors of Graham-and-Doddsville Warren Buffett described how share prices do not always rationally reflect the value of a business. By comparing earnings per share (EPS) and share price changes over time, we can get a feel for how investor attitudes to a company have morphed over time.
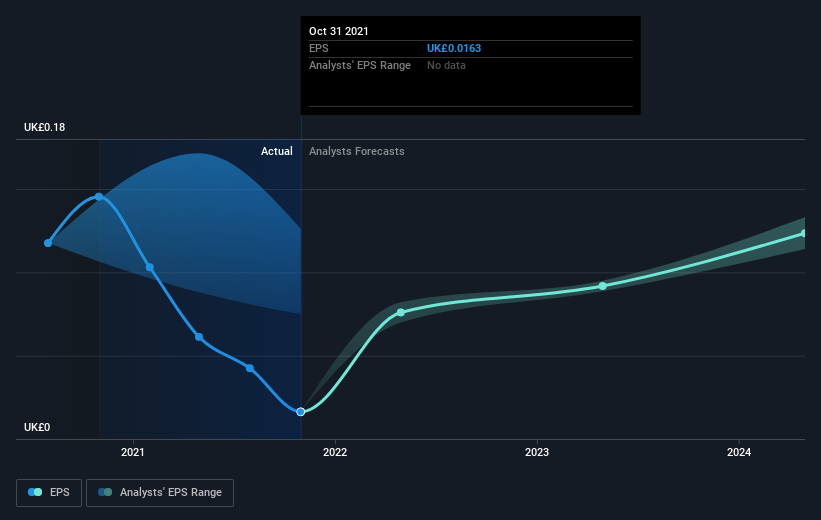
Unfortunately Moonpig Group reported an EPS drop of 89% for the last year. The share price fall of 48% isn't as bad as the reduction in earnings per share. It may have been that the weak EPS was not as bad as some had feared. With a P/E ratio of 90.89, it's fair to say the market sees an EPS rebound on the cards.
The graphic below depicts how EPS has changed over time (unveil the exact values by clicking on the image).
It's probably worth noting we've seen significant insider buying in the last quarter, which we consider a positive. That said, we think earnings and revenue growth trends are even more important factors to consider. It might be well worthwhile taking a look at our free report on Moonpig Group's earnings, revenue and cash flow.
A Different Perspective
While Moonpig Group shareholders are down 48% for the year, the market itself is up 6.2%. However, keep in mind that even the best stocks will sometimes underperform the market over a twelve month period. The share price decline has continued throughout the most recent three months, down 41%, suggesting an absence of enthusiasm from investors. Given the relatively short history of this stock, we'd remain pretty wary until we see some strong business performance. It's always interesting to track share price performance over the longer term. But to understand Moonpig Group better, we need to consider many other factors. For example, we've discovered 5 warning signs for Moonpig Group that you should be aware of before investing here.
There are plenty of other companies that have insiders buying up shares. You probably do not want to miss this free list of growing companies that insiders are buying.
Please note, the market returns quoted in this article reflect the market weighted average returns of stocks that currently trade on GB exchanges.
Have feedback on this article? Concerned about the content? Get in touch with us directly. Alternatively, email editorial-team (at) simplywallst.com.
This article by Simply Wall St is general in nature. We provide commentary based on historical data and analyst forecasts only using an unbiased methodology and our articles are not intended to be financial advice. It does not constitute a recommendation to buy or sell any stock, and does not take account of your objectives, or your financial situation. We aim to bring you long-term focused analysis driven by fundamental data. Note that our analysis may not factor in the latest price-sensitive company announcements or qualitative material. Simply Wall St has no position in any stocks mentioned.
