
 Yahoo Finance
 Investors in N Brown Group (LON:BWNG) have unfortunately lost 86% over the last five years
Some stocks are best avoided. It hits us in the gut when we see fellow investors suffer a loss. Anyone who held N Brown Group plc (LON:BWNG) for five years would be nursing their metaphorical wounds since the share price dropped 87% in that time. And it's not just long term holders hurting, because the stock is down 45% in the last year. The falls have accelerated recently, with the share price down 22% in the last three months. We really feel for shareholders in this scenario. It's a good reminder of the importance of diversification, and it's worth keeping in mind there's more to life than money, anyway.
With that in mind, it's worth seeing if the company's underlying fundamentals have been the driver of long term performance, or if there are some discrepancies.
Check out our latest analysis for N Brown Group
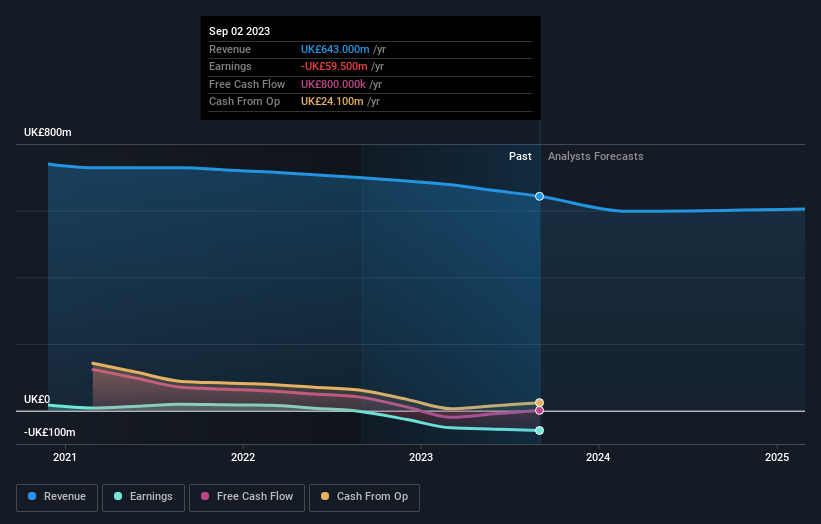
N Brown Group wasn't profitable in the last twelve months, it is unlikely we'll see a strong correlation between its share price and its earnings per share (EPS). Arguably revenue is our next best option. Shareholders of unprofitable companies usually desire strong revenue growth. That's because it's hard to be confident a company will be sustainable if revenue growth is negligible, and it never makes a profit.
Over half a decade N Brown Group reduced its trailing twelve month revenue by 7.5% for each year. That's not what investors generally want to see. If a business loses money, you want it to grow, so no surprises that the share price has dropped 13% each year in that time. We're generally averse to companies with declining revenues, but we're not alone in that. That is not really what the successful investors we know aim for.
The company's revenue and earnings (over time) are depicted in the image below (click to see the exact numbers).
You can see how its balance sheet has strengthened (or weakened) over time in this free interactive graphic.
A Different Perspective
While the broader market gained around 3.4% in the last year, N Brown Group shareholders lost 45%. Even the share prices of good stocks drop sometimes, but we want to see improvements in the fundamental metrics of a business, before getting too interested. Regrettably, last year's performance caps off a bad run, with the shareholders facing a total loss of 13% per year over five years. Generally speaking long term share price weakness can be a bad sign, though contrarian investors might want to research the stock in hope of a turnaround. It's always interesting to track share price performance over the longer term. But to understand N Brown Group better, we need to consider many other factors. Even so, be aware that N Brown Group is showing 3 warning signs in our investment analysis , and 2 of those are significant...
Of course N Brown Group may not be the best stock to buy. So you may wish to see this free collection of growth stocks.
Please note, the market returns quoted in this article reflect the market weighted average returns of stocks that currently trade on British exchanges.
Have feedback on this article? Concerned about the content? Get in touch with us directly. Alternatively, email editorial-team (at) simplywallst.com.
This article by Simply Wall St is general in nature. We provide commentary based on historical data and analyst forecasts only using an unbiased methodology and our articles are not intended to be financial advice. It does not constitute a recommendation to buy or sell any stock, and does not take account of your objectives, or your financial situation. We aim to bring you long-term focused analysis driven by fundamental data. Note that our analysis may not factor in the latest price-sensitive company announcements or qualitative material. Simply Wall St has no position in any stocks mentioned.
