
 Yahoo Finance
 Investors in Ohio Valley Banc (NASDAQ:OVBC) have unfortunately lost 28% over the last five years
Ideally, your overall portfolio should beat the market average. But the main game is to find enough winners to more than offset the losers So we wouldn't blame long term Ohio Valley Banc Corp. (NASDAQ:OVBC) shareholders for doubting their decision to hold, with the stock down 39% over a half decade.
Since shareholders are down over the longer term, lets look at the underlying fundamentals over the that time and see if they've been consistent with returns.
Check out our latest analysis for Ohio Valley Banc
To quote Buffett, 'Ships will sail around the world but the Flat Earth Society will flourish. There will continue to be wide discrepancies between price and value in the marketplace...' By comparing earnings per share (EPS) and share price changes over time, we can get a feel for how investor attitudes to a company have morphed over time.
While the share price declined over five years, Ohio Valley Banc actually managed to increase EPS by an average of 0.8% per year. Given the share price reaction, one might suspect that EPS is not a good guide to the business performance during the period (perhaps due to a one-off loss or gain). Or possibly, the market was previously very optimistic, so the stock has disappointed, despite improving EPS.
Based on these numbers, we'd venture that the market may have been over-optimistic about forecast growth, half a decade ago. Having said that, we might get a better idea of what's going on with the stock by looking at other metrics.
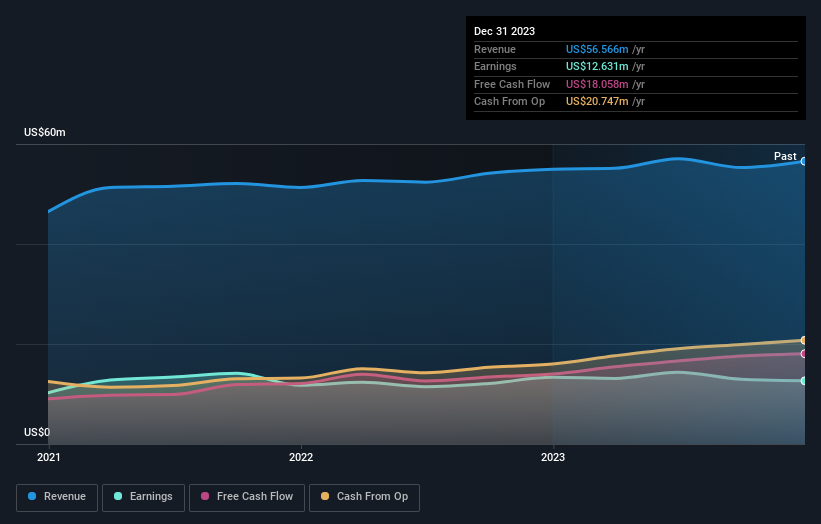
In contrast to the share price, revenue has actually increased by 3.1% a year in the five year period. A more detailed examination of the revenue and earnings may or may not explain why the share price languishes; there could be an opportunity.
The graphic below depicts how earnings and revenue have changed over time (unveil the exact values by clicking on the image).
You can see how its balance sheet has strengthened (or weakened) over time in this free interactive graphic.
What About Dividends?
It is important to consider the total shareholder return, as well as the share price return, for any given stock. The TSR is a return calculation that accounts for the value of cash dividends (assuming that any dividend received was reinvested) and the calculated value of any discounted capital raisings and spin-offs. Arguably, the TSR gives a more comprehensive picture of the return generated by a stock. We note that for Ohio Valley Banc the TSR over the last 5 years was -28%, which is better than the share price return mentioned above. This is largely a result of its dividend payments!
A Different Perspective
Ohio Valley Banc shareholders are up 2.2% for the year (even including dividends). But that return falls short of the market. But at least that's still a gain! Over five years the TSR has been a reduction of 5% per year, over five years. So this might be a sign the business has turned its fortunes around. Before spending more time on Ohio Valley Banc it might be wise to click here to see if insiders have been buying or selling shares.
We will like Ohio Valley Banc better if we see some big insider buys. While we wait, check out this free list of growing companies with considerable, recent, insider buying.
Please note, the market returns quoted in this article reflect the market weighted average returns of stocks that currently trade on American exchanges.
Have feedback on this article? Concerned about the content? Get in touch with us directly. Alternatively, email editorial-team (at) simplywallst.com.
This article by Simply Wall St is general in nature. We provide commentary based on historical data and analyst forecasts only using an unbiased methodology and our articles are not intended to be financial advice. It does not constitute a recommendation to buy or sell any stock, and does not take account of your objectives, or your financial situation. We aim to bring you long-term focused analysis driven by fundamental data. Note that our analysis may not factor in the latest price-sensitive company announcements or qualitative material. Simply Wall St has no position in any stocks mentioned.
