
 Yahoo Finance
 Investors in ORBIS (ETR:OBS) have unfortunately lost 20% over the last year
It's easy to match the overall market return by buying an index fund. But if you buy individual stocks, you can do both better or worse than that. Unfortunately the ORBIS AG (ETR:OBS) share price slid 22% over twelve months. That's disappointing when you consider the market returned 21%. At least the damage isn't so bad if you look at the last three years, since the stock is down 11% in that time. The falls have accelerated recently, with the share price down 21% in the last three months.
It's worthwhile assessing if the company's economics have been moving in lockstep with these underwhelming shareholder returns, or if there is some disparity between the two. So let's do just that.
See our latest analysis for ORBIS
In his essay The Superinvestors of Graham-and-Doddsville Warren Buffett described how share prices do not always rationally reflect the value of a business. One flawed but reasonable way to assess how sentiment around a company has changed is to compare the earnings per share (EPS) with the share price.
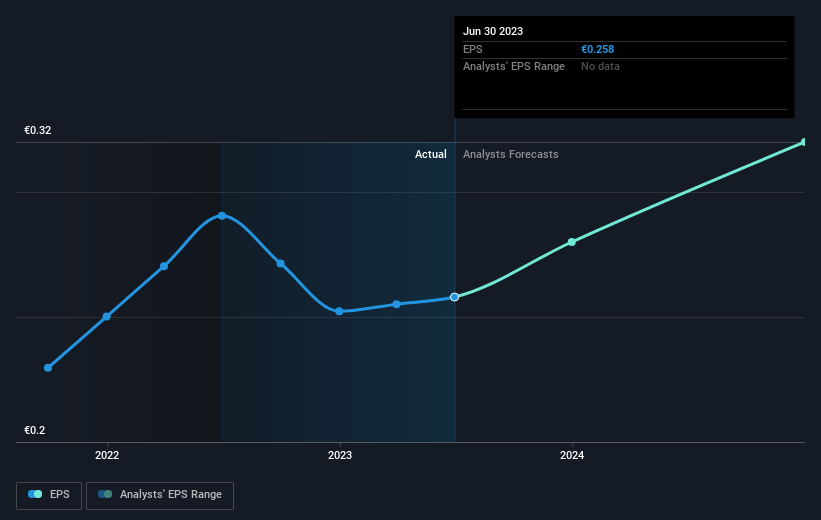
Unfortunately ORBIS reported an EPS drop of 11% for the last year. This reduction in EPS is not as bad as the 22% share price fall. Unsurprisingly, given the lack of EPS growth, the market seems to be more cautious about the stock.
You can see below how EPS has changed over time (discover the exact values by clicking on the image).
Dive deeper into ORBIS' key metrics by checking this interactive graph of ORBIS's earnings, revenue and cash flow.
A Different Perspective
Investors in ORBIS had a tough year, with a total loss of 20% (including dividends), against a market gain of about 21%. However, keep in mind that even the best stocks will sometimes underperform the market over a twelve month period. Longer term investors wouldn't be so upset, since they would have made 5%, each year, over five years. It could be that the recent sell-off is an opportunity, so it may be worth checking the fundamental data for signs of a long term growth trend. It's always interesting to track share price performance over the longer term. But to understand ORBIS better, we need to consider many other factors. Take risks, for example - ORBIS has 2 warning signs we think you should be aware of.
Of course ORBIS may not be the best stock to buy. So you may wish to see this free collection of growth stocks.
Please note, the market returns quoted in this article reflect the market weighted average returns of stocks that currently trade on German exchanges.
Have feedback on this article? Concerned about the content? Get in touch with us directly. Alternatively, email editorial-team (at) simplywallst.com.
This article by Simply Wall St is general in nature. We provide commentary based on historical data and analyst forecasts only using an unbiased methodology and our articles are not intended to be financial advice. It does not constitute a recommendation to buy or sell any stock, and does not take account of your objectives, or your financial situation. We aim to bring you long-term focused analysis driven by fundamental data. Note that our analysis may not factor in the latest price-sensitive company announcements or qualitative material. Simply Wall St has no position in any stocks mentioned.
