
 Yahoo Finance
 Investors in Orca Energy Group (CVE:ORC.B) have unfortunately lost 7.1% over the last three years
Many investors define successful investing as beating the market average over the long term. But in any portfolio, there are likely to be some stocks that fall short of that benchmark. Unfortunately, that's been the case for longer term Orca Energy Group Inc. (CVE:ORC.B) shareholders, since the share price is down 27% in the last three years, falling well short of the market return of around 24%.
Now let's have a look at the company's fundamentals, and see if the long term shareholder return has matched the performance of the underlying business.
View our latest analysis for Orca Energy Group
In his essay The Superinvestors of Graham-and-Doddsville Warren Buffett described how share prices do not always rationally reflect the value of a business. By comparing earnings per share (EPS) and share price changes over time, we can get a feel for how investor attitudes to a company have morphed over time.
Orca Energy Group saw its EPS decline at a compound rate of 23% per year, over the last three years. In comparison the 10% compound annual share price decline isn't as bad as the EPS drop-off. So the market may not be too worried about the EPS figure, at the moment -- or it may have previously priced some of the drop in.
The graphic below depicts how EPS has changed over time (unveil the exact values by clicking on the image).
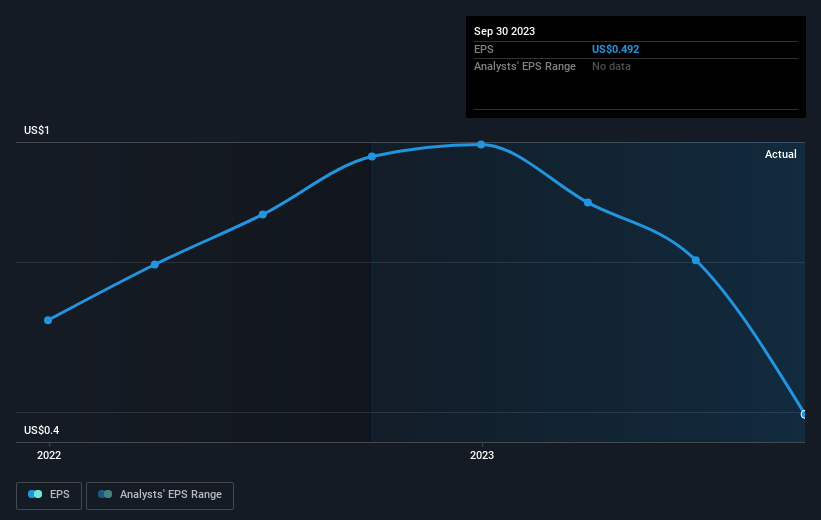
Dive deeper into Orca Energy Group's key metrics by checking this interactive graph of Orca Energy Group's earnings, revenue and cash flow.
What About Dividends?
When looking at investment returns, it is important to consider the difference between total shareholder return (TSR) and share price return. Whereas the share price return only reflects the change in the share price, the TSR includes the value of dividends (assuming they were reinvested) and the benefit of any discounted capital raising or spin-off. So for companies that pay a generous dividend, the TSR is often a lot higher than the share price return. As it happens, Orca Energy Group's TSR for the last 3 years was -7.1%, which exceeds the share price return mentioned earlier. This is largely a result of its dividend payments!
A Different Perspective
Orca Energy Group shareholders are down 13% for the year (even including dividends), but the market itself is up 14%. However, keep in mind that even the best stocks will sometimes underperform the market over a twelve month period. On the bright side, long term shareholders have made money, with a gain of 2% per year over half a decade. It could be that the recent sell-off is an opportunity, so it may be worth checking the fundamental data for signs of a long term growth trend. While it is well worth considering the different impacts that market conditions can have on the share price, there are other factors that are even more important. Consider for instance, the ever-present spectre of investment risk. We've identified 2 warning signs with Orca Energy Group , and understanding them should be part of your investment process.
For those who like to find winning investments this free list of growing companies with recent insider purchasing, could be just the ticket.
Please note, the market returns quoted in this article reflect the market weighted average returns of stocks that currently trade on Canadian exchanges.
Have feedback on this article? Concerned about the content? Get in touch with us directly. Alternatively, email editorial-team (at) simplywallst.com.
This article by Simply Wall St is general in nature. We provide commentary based on historical data and analyst forecasts only using an unbiased methodology and our articles are not intended to be financial advice. It does not constitute a recommendation to buy or sell any stock, and does not take account of your objectives, or your financial situation. We aim to bring you long-term focused analysis driven by fundamental data. Note that our analysis may not factor in the latest price-sensitive company announcements or qualitative material. Simply Wall St has no position in any stocks mentioned.
