
 Yahoo Finance
 Investors in Procter & Gamble (NYSE:PG) have made a favorable return of 82% over the past three years
One simple way to benefit from the stock market is to buy an index fund. But if you pick the right individual stocks, you could make more than that. For example, the The Procter & Gamble Company (NYSE:PG) share price is up 68% in the last three years, clearly besting the market return of around 50% (not including dividends). However, more recent returns haven't been as impressive as that, with the stock returning just 7.6% in the last year , including dividends .
So let's investigate and see if the longer term performance of the company has been in line with the underlying business' progress.
Check out our latest analysis for Procter & Gamble
To quote Buffett, 'Ships will sail around the world but the Flat Earth Society will flourish. There will continue to be wide discrepancies between price and value in the marketplace...' One way to examine how market sentiment has changed over time is to look at the interaction between a company's share price and its earnings per share (EPS).
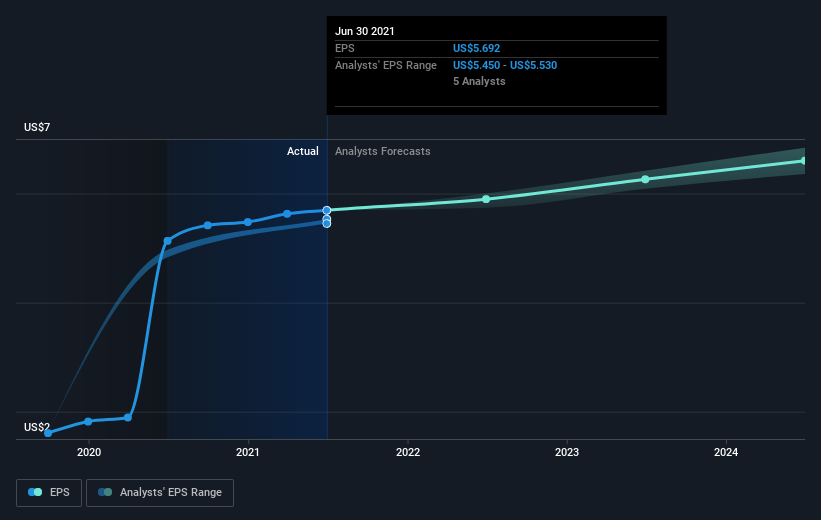
During three years of share price growth, Procter & Gamble achieved compound earnings per share growth of 15% per year. This EPS growth is lower than the 19% average annual increase in the share price. This suggests that, as the business progressed over the last few years, it gained the confidence of market participants. It's not unusual to see the market 're-rate' a stock, after a few years of growth.
The company's earnings per share (over time) is depicted in the image below (click to see the exact numbers).
We know that Procter & Gamble has improved its bottom line lately, but is it going to grow revenue? Check if analysts think Procter & Gamble will grow revenue in the future.
What About Dividends?
It is important to consider the total shareholder return, as well as the share price return, for any given stock. The TSR incorporates the value of any spin-offs or discounted capital raisings, along with any dividends, based on the assumption that the dividends are reinvested. Arguably, the TSR gives a more comprehensive picture of the return generated by a stock. In the case of Procter & Gamble, it has a TSR of 82% for the last 3 years. That exceeds its share price return that we previously mentioned. And there's no prize for guessing that the dividend payments largely explain the divergence!
A Different Perspective
Procter & Gamble shareholders are up 7.6% for the year (even including dividends). Unfortunately this falls short of the market return. If we look back over five years, the returns are even better, coming in at 14% per year for five years. It's quite possible the business continues to execute with prowess, even as the share price gains are slowing. While it is well worth considering the different impacts that market conditions can have on the share price, there are other factors that are even more important. Case in point: We've spotted 2 warning signs for Procter & Gamble you should be aware of.
For those who like to find winning investments this free list of growing companies with recent insider purchasing, could be just the ticket.
Please note, the market returns quoted in this article reflect the market weighted average returns of stocks that currently trade on US exchanges.
This article by Simply Wall St is general in nature. We provide commentary based on historical data and analyst forecasts only using an unbiased methodology and our articles are not intended to be financial advice. It does not constitute a recommendation to buy or sell any stock, and does not take account of your objectives, or your financial situation. We aim to bring you long-term focused analysis driven by fundamental data. Note that our analysis may not factor in the latest price-sensitive company announcements or qualitative material. Simply Wall St has no position in any stocks mentioned.
Have feedback on this article? Concerned about the content? Get in touch with us directly. Alternatively, email editorial-team (at) simplywallst.com.
