
 Yahoo Finance
 Investors in ResMed (NYSE:RMD) have made a massive return of 377% over the past five years
Buying shares in the best businesses can build meaningful wealth for you and your family. While not every stock performs well, when investors win, they can win big. To wit, the ResMed Inc. (NYSE:RMD) share price has soared 347% over five years. If that doesn't get you thinking about long term investing, we don't know what will. Also pleasing for shareholders was the 18% gain in the last three months.
So let's assess the underlying fundamentals over the last 5 years and see if they've moved in lock-step with shareholder returns.
Check out our latest analysis for ResMed
In his essay The Superinvestors of Graham-and-Doddsville Warren Buffett described how share prices do not always rationally reflect the value of a business. By comparing earnings per share (EPS) and share price changes over time, we can get a feel for how investor attitudes to a company have morphed over time.
During five years of share price growth, ResMed achieved compound earnings per share (EPS) growth of 5.4% per year. This EPS growth is slower than the share price growth of 35% per year, over the same period. So it's fair to assume the market has a higher opinion of the business than it did five years ago. And that's hardly shocking given the track record of growth. This optimism is visible in its fairly high P/E ratio of 88.50.
You can see below how EPS has changed over time (discover the exact values by clicking on the image).
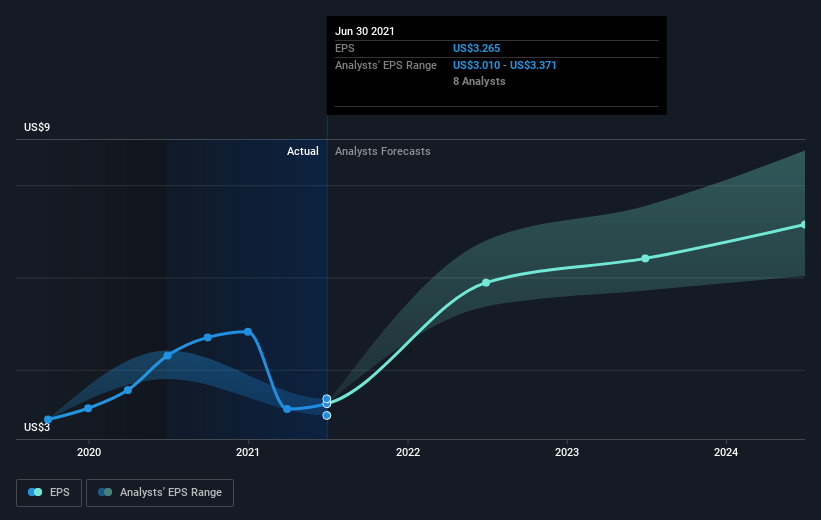
Dive deeper into ResMed's key metrics by checking this interactive graph of ResMed's earnings, revenue and cash flow.
What About Dividends?
When looking at investment returns, it is important to consider the difference between total shareholder return (TSR) and share price return. Whereas the share price return only reflects the change in the share price, the TSR includes the value of dividends (assuming they were reinvested) and the benefit of any discounted capital raising or spin-off. Arguably, the TSR gives a more comprehensive picture of the return generated by a stock. As it happens, ResMed's TSR for the last 5 years was 377%, which exceeds the share price return mentioned earlier. This is largely a result of its dividend payments!
A Different Perspective
We're pleased to report that ResMed shareholders have received a total shareholder return of 69% over one year. Of course, that includes the dividend. Since the one-year TSR is better than the five-year TSR (the latter coming in at 37% per year), it would seem that the stock's performance has improved in recent times. In the best case scenario, this may hint at some real business momentum, implying that now could be a great time to delve deeper. If you would like to research ResMed in more detail then you might want to take a look at whether insiders have been buying or selling shares in the company.
If you like to buy stocks alongside management, then you might just love this free list of companies. (Hint: insiders have been buying them).
Please note, the market returns quoted in this article reflect the market weighted average returns of stocks that currently trade on US exchanges.
This article by Simply Wall St is general in nature. We provide commentary based on historical data and analyst forecasts only using an unbiased methodology and our articles are not intended to be financial advice. It does not constitute a recommendation to buy or sell any stock, and does not take account of your objectives, or your financial situation. We aim to bring you long-term focused analysis driven by fundamental data. Note that our analysis may not factor in the latest price-sensitive company announcements or qualitative material. Simply Wall St has no position in any stocks mentioned.
Have feedback on this article? Concerned about the content? Get in touch with us directly. Alternatively, email editorial-team (at) simplywallst.com.
