Investors in Smiths Group (LON:SMIN) have seen decent returns of 31% over the past three years
One simple way to benefit from the stock market is to buy an index fund. But if you buy good businesses at attractive prices, your portfolio returns could exceed the average market return. For example, the Smiths Group plc (LON:SMIN) share price is up 20% in the last three years, clearly besting the market return of around 13% (not including dividends). However, more recent returns haven't been as impressive as that, with the stock returning just 15% in the last year , including dividends .
So let's investigate and see if the longer term performance of the company has been in line with the underlying business' progress.
See our latest analysis for Smiths Group
While the efficient markets hypothesis continues to be taught by some, it has been proven that markets are over-reactive dynamic systems, and investors are not always rational. One flawed but reasonable way to assess how sentiment around a company has changed is to compare the earnings per share (EPS) with the share price.
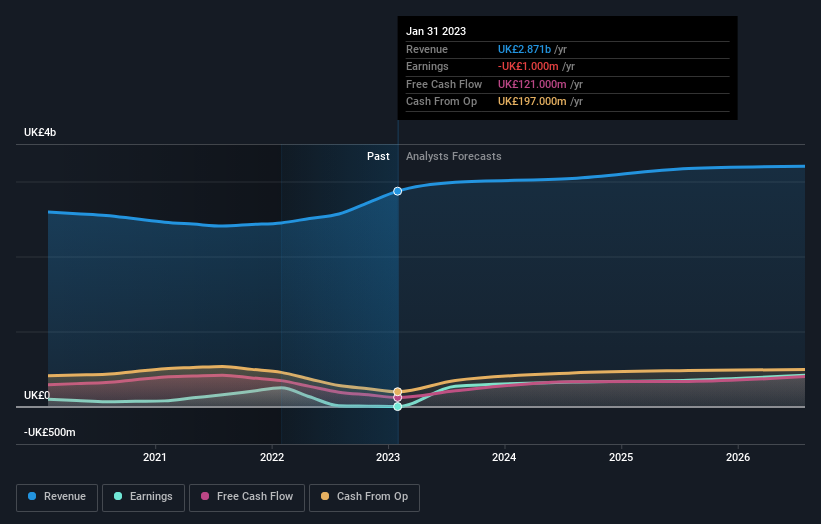
Over the last three years, Smiths Group failed to grow earnings per share, which fell 13% (annualized). This was, in part, due to extraordinary items impacting earning in the last twelve months.
Thus, it seems unlikely that the market is focussed on EPS growth at the moment. Given this situation, it makes sense to look at other metrics too.
Do you think that shareholders are buying for the 2.1% per annum revenue growth trend? We don't. While we don't have an obvious theory to explain the share price rise, a closer look at the data might be enlightening.
You can see how earnings and revenue have changed over time in the image below (click on the chart to see the exact values).
Smiths Group is a well known stock, with plenty of analyst coverage, suggesting some visibility into future growth. You can see what analysts are predicting for Smiths Group in this interactive graph of future profit estimates.
What About Dividends?
When looking at investment returns, it is important to consider the difference between total shareholder return (TSR) and share price return. Whereas the share price return only reflects the change in the share price, the TSR includes the value of dividends (assuming they were reinvested) and the benefit of any discounted capital raising or spin-off. Arguably, the TSR gives a more comprehensive picture of the return generated by a stock. In the case of Smiths Group, it has a TSR of 31% for the last 3 years. That exceeds its share price return that we previously mentioned. The dividends paid by the company have thusly boosted the total shareholder return.
A Different Perspective
It's nice to see that Smiths Group shareholders have received a total shareholder return of 15% over the last year. Of course, that includes the dividend. That's better than the annualised return of 4% over half a decade, implying that the company is doing better recently. Someone with an optimistic perspective could view the recent improvement in TSR as indicating that the business itself is getting better with time. I find it very interesting to look at share price over the long term as a proxy for business performance. But to truly gain insight, we need to consider other information, too. Take risks, for example - Smiths Group has 1 warning sign we think you should be aware of.
Of course Smiths Group may not be the best stock to buy. So you may wish to see this free collection of growth stocks.
Please note, the market returns quoted in this article reflect the market weighted average returns of stocks that currently trade on British exchanges.
Have feedback on this article? Concerned about the content? Get in touch with us directly. Alternatively, email editorial-team (at) simplywallst.com.
This article by Simply Wall St is general in nature. We provide commentary based on historical data and analyst forecasts only using an unbiased methodology and our articles are not intended to be financial advice. It does not constitute a recommendation to buy or sell any stock, and does not take account of your objectives, or your financial situation. We aim to bring you long-term focused analysis driven by fundamental data. Note that our analysis may not factor in the latest price-sensitive company announcements or qualitative material. Simply Wall St has no position in any stocks mentioned.
Join A Paid User Research Session
You’ll receive a US$30 Amazon Gift card for 1 hour of your time while helping us build better investing tools for the individual investors like yourself. Sign up here