
 Yahoo Finance
 Investors in Steinhoff International Holdings (JSE:SNH) have made a respectable return of 100% over the past three years
While Steinhoff International Holdings N.V. (JSE:SNH) shareholders are probably generally happy, the stock hasn't had particularly good run recently, with the share price falling 25% in the last quarter. But don't let that distract from the very nice return generated over three years. In the last three years the share price is up, 100%: better than the market.
With that in mind, it's worth seeing if the company's underlying fundamentals have been the driver of long term performance, or if there are some discrepancies.
View our latest analysis for Steinhoff International Holdings
Steinhoff International Holdings isn't currently profitable, so most analysts would look to revenue growth to get an idea of how fast the underlying business is growing. Shareholders of unprofitable companies usually expect strong revenue growth. That's because fast revenue growth can be easily extrapolated to forecast profits, often of considerable size.
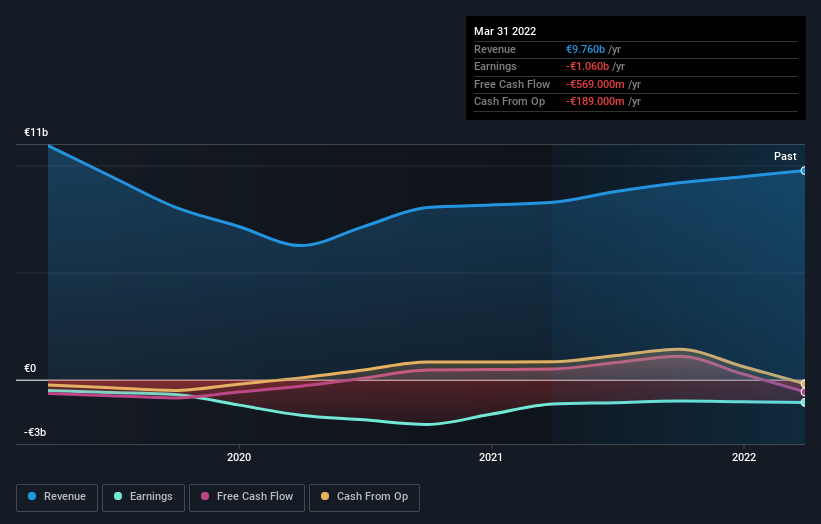
Over the last three years Steinhoff International Holdings has grown its revenue at 1.9% annually. That's not a very high growth rate considering it doesn't make profits. The modest growth is probably broadly reflected in the share price, which is up 26%, per year over 3 years. Ultimately, the important thing is whether the company is trending to profitability. Given the market doesn't seem too excited about the stock, a closer look at the financial data could pay off, if you can find indications of a stronger growth trend in the future.
The graphic below depicts how earnings and revenue have changed over time (unveil the exact values by clicking on the image).
Take a more thorough look at Steinhoff International Holdings' financial health with this free report on its balance sheet.
A Different Perspective
Steinhoff International Holdings shareholders are down 35% for the year, but the market itself is up 7.7%. Even the share prices of good stocks drop sometimes, but we want to see improvements in the fundamental metrics of a business, before getting too interested. Unfortunately, last year's performance may indicate unresolved challenges, given that it was worse than the annualised loss of 12% over the last half decade. Generally speaking long term share price weakness can be a bad sign, though contrarian investors might want to research the stock in hope of a turnaround. It's always interesting to track share price performance over the longer term. But to understand Steinhoff International Holdings better, we need to consider many other factors. For example, we've discovered 1 warning sign for Steinhoff International Holdings that you should be aware of before investing here.
But note: Steinhoff International Holdings may not be the best stock to buy. So take a peek at this free list of interesting companies with past earnings growth (and further growth forecast).
Please note, the market returns quoted in this article reflect the market weighted average returns of stocks that currently trade on ZA exchanges.
Have feedback on this article? Concerned about the content? Get in touch with us directly. Alternatively, email editorial-team (at) simplywallst.com.
This article by Simply Wall St is general in nature. We provide commentary based on historical data and analyst forecasts only using an unbiased methodology and our articles are not intended to be financial advice. It does not constitute a recommendation to buy or sell any stock, and does not take account of your objectives, or your financial situation. We aim to bring you long-term focused analysis driven by fundamental data. Note that our analysis may not factor in the latest price-sensitive company announcements or qualitative material. Simply Wall St has no position in any stocks mentioned.
Join A Paid User Research Session
You’ll receive a US$30 Amazon Gift card for 1 hour of your time while helping us build better investing tools for the individual investors like yourself. Sign up here
