
 Yahoo Finance
 Investors in Summit Materials (NYSE:SUM) have unfortunately lost 32% over the last year
Investors can approximate the average market return by buying an index fund. Active investors aim to buy stocks that vastly outperform the market - but in the process, they risk under-performance. Unfortunately the Summit Materials, Inc. (NYSE:SUM) share price slid 32% over twelve months. That's well below the market decline of 17%. The silver lining (for longer term investors) is that the stock is still 26% higher than it was three years ago. Shareholders have had an even rougher run lately, with the share price down 23% in the last 90 days. Of course, this share price action may well have been influenced by the 15% decline in the broader market, throughout the period.
With that in mind, it's worth seeing if the company's underlying fundamentals have been the driver of long term performance, or if there are some discrepancies.
Check out our latest analysis for Summit Materials
To quote Buffett, 'Ships will sail around the world but the Flat Earth Society will flourish. There will continue to be wide discrepancies between price and value in the marketplace...' One imperfect but simple way to consider how the market perception of a company has shifted is to compare the change in the earnings per share (EPS) with the share price movement.
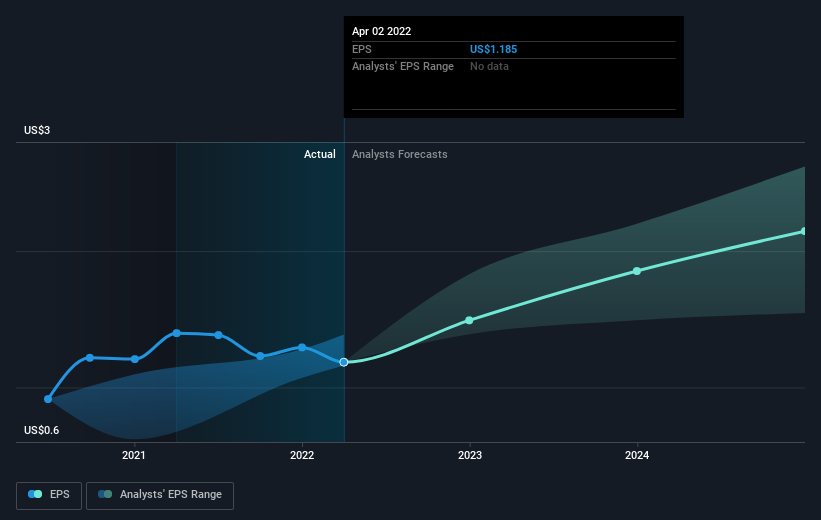
Unhappily, Summit Materials had to report a 15% decline in EPS over the last year. This reduction in EPS is not as bad as the 32% share price fall. Unsurprisingly, given the lack of EPS growth, the market seems to be more cautious about the stock.
You can see below how EPS has changed over time (discover the exact values by clicking on the image).
It is of course excellent to see how Summit Materials has grown profits over the years, but the future is more important for shareholders. You can see how its balance sheet has strengthened (or weakened) over time in this free interactive graphic.
A Different Perspective
We regret to report that Summit Materials shareholders are down 32% for the year. Unfortunately, that's worse than the broader market decline of 17%. Having said that, it's inevitable that some stocks will be oversold in a falling market. The key is to keep your eyes on the fundamental developments. Unfortunately, last year's performance may indicate unresolved challenges, given that it was worse than the annualised loss of 3% over the last half decade. We realise that Baron Rothschild has said investors should "buy when there is blood on the streets", but we caution that investors should first be sure they are buying a high quality business. It's always interesting to track share price performance over the longer term. But to understand Summit Materials better, we need to consider many other factors. For instance, we've identified 3 warning signs for Summit Materials (1 makes us a bit uncomfortable) that you should be aware of.
We will like Summit Materials better if we see some big insider buys. While we wait, check out this free list of growing companies with considerable, recent, insider buying.
Please note, the market returns quoted in this article reflect the market weighted average returns of stocks that currently trade on US exchanges.
Have feedback on this article? Concerned about the content? Get in touch with us directly. Alternatively, email editorial-team (at) simplywallst.com.
This article by Simply Wall St is general in nature. We provide commentary based on historical data and analyst forecasts only using an unbiased methodology and our articles are not intended to be financial advice. It does not constitute a recommendation to buy or sell any stock, and does not take account of your objectives, or your financial situation. We aim to bring you long-term focused analysis driven by fundamental data. Note that our analysis may not factor in the latest price-sensitive company announcements or qualitative material. Simply Wall St has no position in any stocks mentioned.
