
 Yahoo Finance
 Investors in Supreme (LON:SUP) have unfortunately lost 42% over the last year
Passive investing in an index fund is a good way to ensure your own returns roughly match the overall market. While individual stocks can be big winners, plenty more fail to generate satisfactory returns. That downside risk was realized by Supreme Plc (LON:SUP) shareholders over the last year, as the share price declined 45%. That falls noticeably short of the market decline of around 4.5%. Supreme may have better days ahead, of course; we've only looked at a one year period.
It's worthwhile assessing if the company's economics have been moving in lockstep with these underwhelming shareholder returns, or if there is some disparity between the two. So let's do just that.
Check out our latest analysis for Supreme
While markets are a powerful pricing mechanism, share prices reflect investor sentiment, not just underlying business performance. One way to examine how market sentiment has changed over time is to look at the interaction between a company's share price and its earnings per share (EPS).
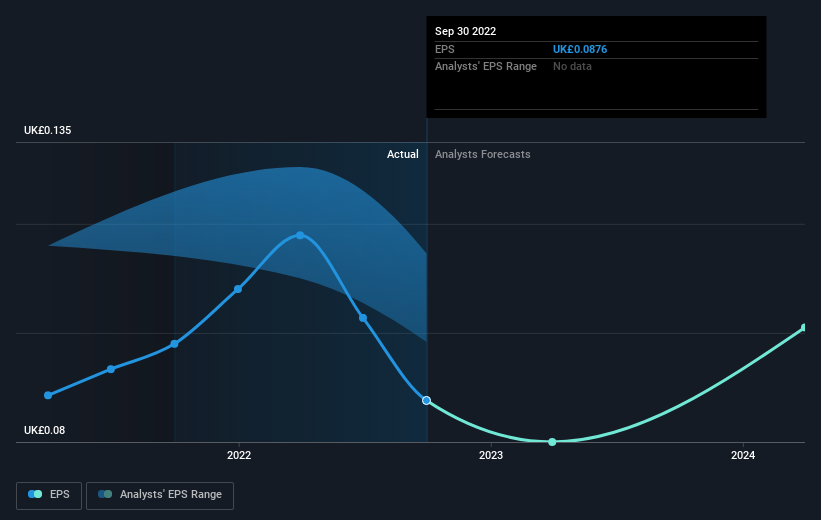
Unhappily, Supreme had to report a 11% decline in EPS over the last year. This reduction in EPS is not as bad as the 45% share price fall. This suggests the EPS fall has made some shareholders are more nervous about the business. The less favorable sentiment is reflected in its current P/E ratio of 11.47.
You can see how EPS has changed over time in the image below (click on the chart to see the exact values).
Dive deeper into Supreme's key metrics by checking this interactive graph of Supreme's earnings, revenue and cash flow.
What About Dividends?
As well as measuring the share price return, investors should also consider the total shareholder return (TSR). The TSR is a return calculation that accounts for the value of cash dividends (assuming that any dividend received was reinvested) and the calculated value of any discounted capital raisings and spin-offs. So for companies that pay a generous dividend, the TSR is often a lot higher than the share price return. We note that for Supreme the TSR over the last 1 year was -42%, which is better than the share price return mentioned above. And there's no prize for guessing that the dividend payments largely explain the divergence!
A Different Perspective
While Supreme shareholders are down 42% for the year (even including dividends), the market itself is up 4.5%. While the aim is to do better than that, it's worth recalling that even great long-term investments sometimes underperform for a year or more. The share price decline has continued throughout the most recent three months, down 0.5%, suggesting an absence of enthusiasm from investors. Basically, most investors should be wary of buying into a poor-performing stock, unless the business itself has clearly improved. I find it very interesting to look at share price over the long term as a proxy for business performance. But to truly gain insight, we need to consider other information, too. For example, we've discovered 1 warning sign for Supreme that you should be aware of before investing here.
Of course, you might find a fantastic investment by looking elsewhere. So take a peek at this free list of companies we expect will grow earnings.
Please note, the market returns quoted in this article reflect the market weighted average returns of stocks that currently trade on British exchanges.
Have feedback on this article? Concerned about the content? Get in touch with us directly. Alternatively, email editorial-team (at) simplywallst.com.
This article by Simply Wall St is general in nature. We provide commentary based on historical data and analyst forecasts only using an unbiased methodology and our articles are not intended to be financial advice. It does not constitute a recommendation to buy or sell any stock, and does not take account of your objectives, or your financial situation. We aim to bring you long-term focused analysis driven by fundamental data. Note that our analysis may not factor in the latest price-sensitive company announcements or qualitative material. Simply Wall St has no position in any stocks mentioned.
Join A Paid User Research Session
You’ll receive a US$30 Amazon Gift card for 1 hour of your time while helping us build better investing tools for the individual investors like yourself. Sign up here
