
 Yahoo Finance
 Investors in Symbotic (NASDAQ:SYM) have made a decent return of 31% over the past year
Symbotic Inc. (NASDAQ:SYM) shareholders might be concerned after seeing the share price drop 16% in the last quarter. But that doesn't change the fact that the returns over the last year have been pleasing. After all, the share price is up a market-beating 31% in that time.
Now it's worth having a look at the company's fundamentals too, because that will help us determine if the long term shareholder return has matched the performance of the underlying business.
View our latest analysis for Symbotic
Because Symbotic made a loss in the last twelve months, we think the market is probably more focussed on revenue and revenue growth, at least for now. When a company doesn't make profits, we'd generally expect to see good revenue growth. As you can imagine, fast revenue growth, when maintained, often leads to fast profit growth.
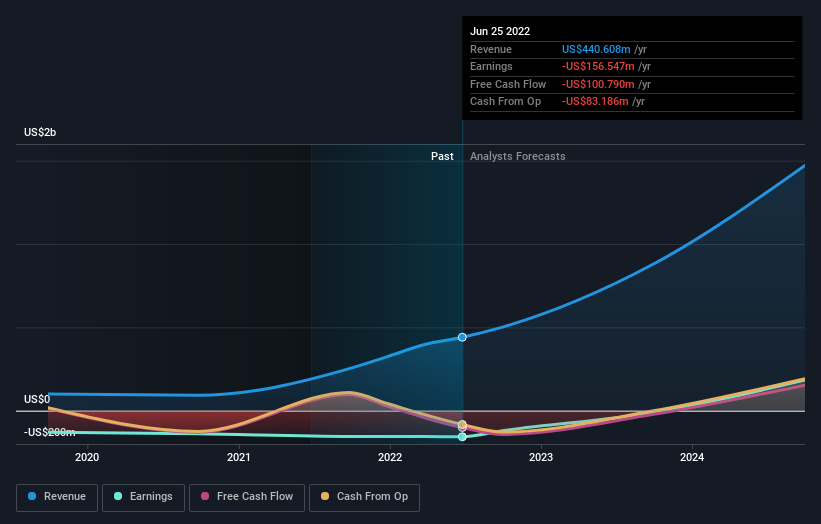
Symbotic grew its revenue by 108% last year. That's well above most other pre-profit companies. The solid 31% share price gain goes down pretty well, but it's not necessarily as good as you might expect given the top notch revenue growth. So quite frankly it could be a good time to investigate Symbotic in some detail. Since we evolved from monkeys, we think in linear terms by nature. So if growth goes exponential, opportunity may exist for the enlightened.
The graphic below depicts how earnings and revenue have changed over time (unveil the exact values by clicking on the image).
Symbotic is well known by investors, and plenty of clever analysts have tried to predict the future profit levels. So we recommend checking out this free report showing consensus forecasts
A Different Perspective
Symbotic shareholders should be happy with the total gain of 31% over the last twelve months. Unfortunately the share price is down 16% over the last quarter. Shorter term share price moves often don't signify much about the business itself. I find it very interesting to look at share price over the long term as a proxy for business performance. But to truly gain insight, we need to consider other information, too. Consider for instance, the ever-present spectre of investment risk. We've identified 3 warning signs with Symbotic (at least 1 which makes us a bit uncomfortable) , and understanding them should be part of your investment process.
If you like to buy stocks alongside management, then you might just love this free list of companies. (Hint: insiders have been buying them).
Please note, the market returns quoted in this article reflect the market weighted average returns of stocks that currently trade on US exchanges.
Have feedback on this article? Concerned about the content? Get in touch with us directly. Alternatively, email editorial-team (at) simplywallst.com.
This article by Simply Wall St is general in nature. We provide commentary based on historical data and analyst forecasts only using an unbiased methodology and our articles are not intended to be financial advice. It does not constitute a recommendation to buy or sell any stock, and does not take account of your objectives, or your financial situation. We aim to bring you long-term focused analysis driven by fundamental data. Note that our analysis may not factor in the latest price-sensitive company announcements or qualitative material. Simply Wall St has no position in any stocks mentioned.
Join A Paid User Research Session
You’ll receive a US$30 Amazon Gift card for 1 hour of your time while helping us build better investing tools for the individual investors like yourself. Sign up here
